Why Are Gold, Silver, Crypto Falling? BTC $60K, XAU $3,760 in Focus


Why are gold, silver, crypto falling at the same time? The short answer is rate hike fears.
Spot gold trades below $3,800 on Wednesday. Spot silver is below $46. Both are near their lowest levels in just over a year.
Crypto is also weak. The Fear & Greed Index reads 11, which is Extreme Fear. Traders now wait for the Fed's October meeting minutes.
What Is Pushing Prices Lower?
The US dollar is the main pressure point. The US Dollar Index (DXY) recently hit a 19-month high near 103.75.
The 10-year US Treasury yield also sits above 5%. A strong dollar and high yields usually hurt gold, silver and risk assets.
US retail sales rose 0.2% in October, down from 0.8% in September. Rate hike bets stayed alive.
St. Louis Fed President Alberto Musalem said the Fed may need to raise rates several times before next spring.
Strong Nvidia earnings lifted chip stocks, yet crypto stayed near recent lows.
Why Are Gold, Silver, Crypto Falling? Key Levels at a Glance
Asset | Key Support | Next Support | Key Resistance |
Gold (XAU) | $3,760 | $3,500 to $3,600 | $4,000 |
Silver (XAG) | $44 to $45 | $35 to $40 | $50 |
Bitcoin (BTC) | $62,000 to $60,000 | $58,000 | $69,600 |
Ethereum (ETH) | $1,750 to $1,700 | $1,600 | $2,047 |
XRP | $0.94 to $0.95 | $0.85 | $1.00 to $1.05 |
Gold Price Forecast: $3,760 Support Faces Breakdown Risk
Gold formed a triangle from the January 2026 highs. Price broke below it in November.
Now it nears a descending trend line from the October 2025 highs. That support sits near $3,760.
A confirmed break could send gold toward $3,500 to $3,600. A move back above $4,000 would open $4,150.
The 20, 50, 100 and 200-day moving averages point down, and RSI is below the midline.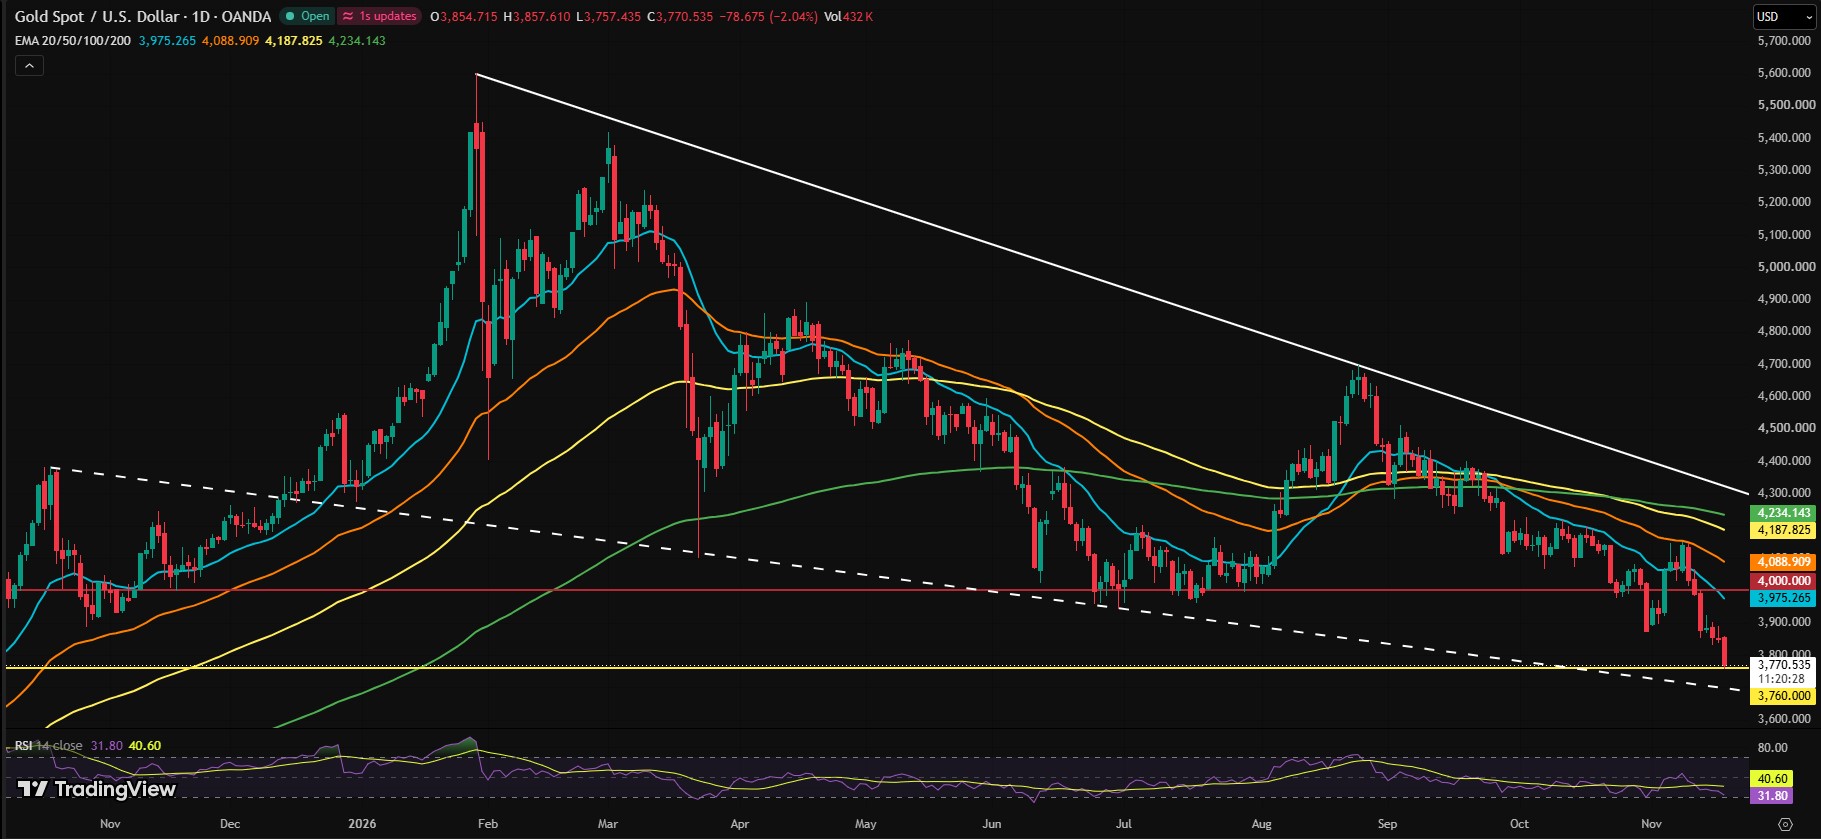
Trader Peter Brandt flagged a head and shoulders pattern on gold. His Oct. 9 chart showed gold at $4,183 with the neckline near $3,900.
Gold has since broken that neckline. By his measurement, the target is about $2,890. He said it was not a prediction.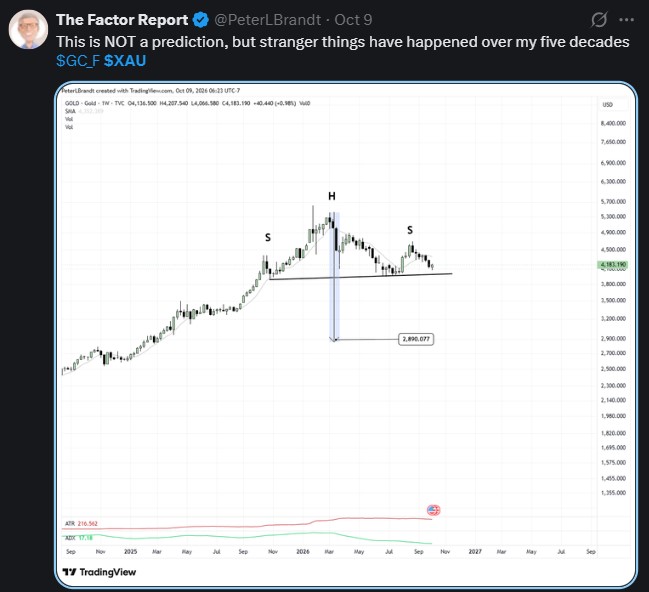
Silver Price Forecast: Can $44 to $45 Hold?
Silver broke below its triangle at $49. That pointed to a drop toward $45.
Support sits at $44 to $45.
A break below $44 may open $35 to $40. Silver needs to reclaim $50 to ease the pressure.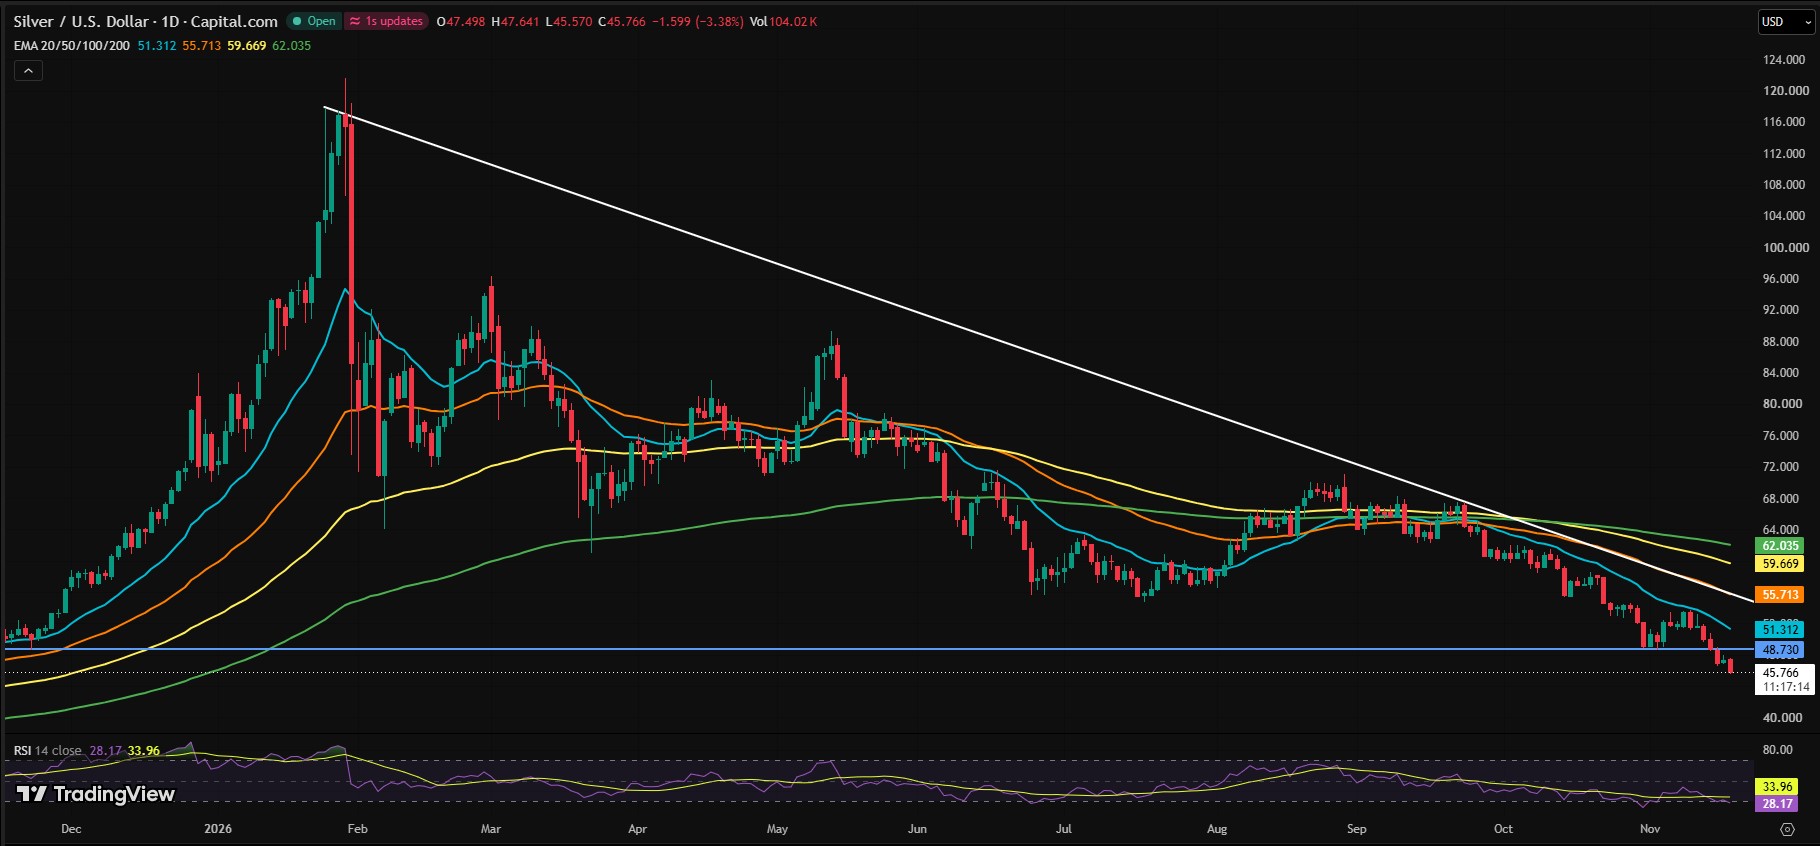
On Oct. 30, Brandt asked if someone would say "40s." His weekly chart showed silver sliding in a falling channel since its early-2026 peak.
He likened it to traders who bought above $100 now rushing out. He is not in a hurry to buy the first short-covering rally.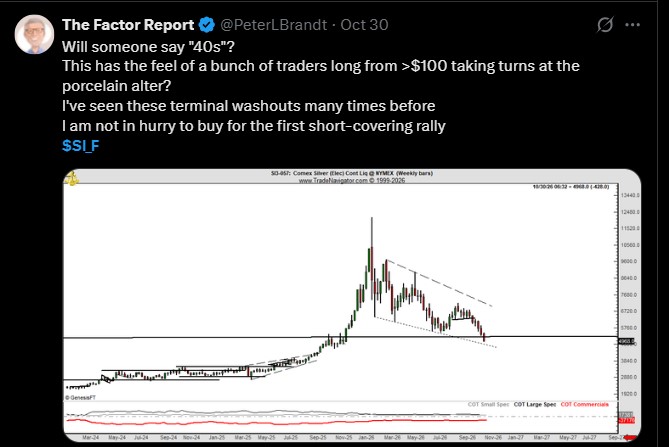
Bitcoin Price Prediction: $60K Trendline in Focus
On the weekly chart, BTC was rejected near $85,000 to $87,000. It then fell under the 20, 50, 100 and 200-week EMAs.
Weekly Indicator | Value |
20-week EMA | $74,485 |
50-week EMA | $77,350 |
100-week EMA | $78,311 |
200-week EMA | $69,641 |
RSI | 37.90 |
Price now tests an ascending trendline near $62,000 to $60,000. This zone matters most.
A weekly close below it could send BTC toward $58,000, then $55,000 to $52,000. If buyers reclaim $69,600, a bounce toward $74,500 to $78,300 is possible.
Liquidations Show Where the Pain Is
CoinGlass data shows $370.40M in liquidations over 24 hours. About 97,297 traders were hit. Binance had the largest share at 41.2%.
Period | Total | Longs | Shorts |
1 hour | $4.93M | $3.30M | $1.63M |
4 hours | $16.26M | $9.51M | $6.74M |
12 hours | $90.08M | $39.06M | $51.02M |
24 hours | $370.40M | $230.39M | $140.01M |
Longs made up 62.2% of the 24-hour total.
BTC led with $118.44M, and 56.9% of it was long. ETH followed at $65.18M, with 57.5% long.
Gold saw $8.30M in liquidations and silver $2.66M. SOL ($14.73M), XRP ($5.98M) and ZEC ($8.43M) were short-dominant.
The largest single order was a $5.39M BTC-USD short on Hyperliquid at $65,179.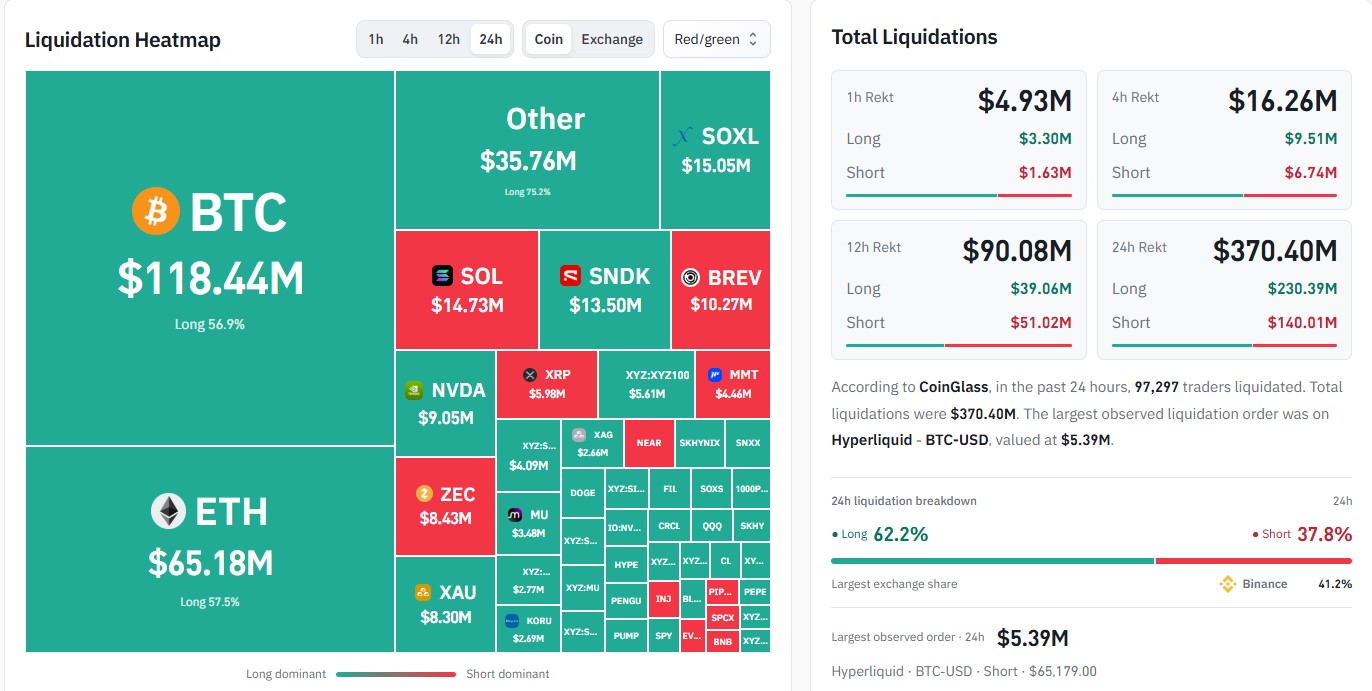
Spot ETF Flows Stay Negative
US spot crypto ETFs saw outflows on Nov. 17.
Asset | 1-Day Flow | 30-Day Flow | Total Inflow | Net Assets | % of Market Cap |
BTC | -$239.94M | -$2.48B | $54.42B | $79.65B | 6.15% |
ETH | -$29.09M | -$1.46B | $11.49B | $9.97B | 4.52% |
XRP | -$6.14M | -$17.21M | $1.79B | $1.08B | 1.70% |
BTC ETFs traded $2.35B against a $1.29T market cap. ETH traded 559.61M(220.67B cap) and XRP 22.16M(63.54B cap).
Ethereum Price Prediction: Deeply Oversold, Still Bearish
ETH trades under all four daily moving averages. The 20 EMA is at $2,047, the 50 at $2,226, the 100 at $2,265 and the 200 at $2,275.
RSI is 25.48, a deeply oversold reading. Trader Tardigrade noted ETH gave a similar signal in June.
Back then, price bounced, retested the low, then moved higher. A repeat is possible. It is not guaranteed.
A rising trendline near $1,700 to $1,750 is key support. The 24-hour low of $1,750.1 sits just above it.
A daily close under $1,700 could open $1,600, then $1,500.
XRP Price Prediction: $0.94 Is the Level to Watch
XRP trades at $0.9850. It sits below all four weekly EMAs: $1.2495 (20), $1.4382 (50), $1.5323 (100) and $1.3608 (200).
Weekly RSI is 36.37, near oversold. That could allow a short bounce, not a confirmed bottom.
The weekly low so far is $0.9424. Buyers need to defend $0.94 to $0.95.
Scenario | Trigger | Possible Target |
Bullish | Hold $0.94 to $0.95, then clear $1.05 | $1.25 |
Neutral | Range holds | $0.94 to $1.05 |
Bearish | Daily or weekly close below $0.94 | $0.85, then $0.80 |
Market Mood: Extreme Fear
Fear & Greed Index | Reading | Label |
Now | 11 | Extreme Fear |
Yesterday | 12 | Extreme Fear |
Last week | 29 | Fear |
Last month | 59 | Greed |
Extreme Fear can mark short-term lows, but it can last a while.
What to Watch Next
The Fed's October minutes, US housing data and Fed speakers are next. Traders want clues on 2027 rates.
More hike signals could lift the dollar and yields. A softer Fed tone could spark a rebound.
So, why are gold, silver, crypto falling right now? Rates, the dollar and thin demand. Prices may stay under pressure while gold is below $4,000 and silver is below $50.
Disclaimer
This article is for information only and is not financial advice. Gold, silver and crypto prices are highly volatile, and you can lose money. Price levels and targets are possible scenarios, not guarantees. Always do your own research and speak to a licensed financial advisor before you invest.
















