Hedera Price Prediction: Can HBAR Clear $0.10058 in November?


Has HBAR finally escaped a five-week slide, or is this bounce only a pause?
This Hedera price prediction uses market data captured on Nov 5, 2026, 08:47 UTC. $HBAR trades at $0.07326. The 30-day change is -28.03%. For the longer view, see the November 2026 Hedera forecast.
Hedera Price Today: HBAR Market Snapshot
CoinGecko market data captured on Nov 5, 2026, 08:47 UTC, ranks $HBAR 33. FDV, or fully diluted valuation, is the value if all 50B coins are already circulated.
Metric | Value (Nov 5, 2026, 08:47 UTC) |
Price | $0.07326 |
24h change | +3.6% |
24h range | $0.07011 to $0.07395 |
Market cap | $3.246B |
FDV | $3.662B |
24h trading volume | $67.858M |
Perps open interest | $216.199M |
Circulating supply | 44.327 B HBAR |
Source: CoinGecko Data, Hedera market snapshot, Nov 5, 2026, 08:47 UTC
Hedera Price Forecast: Performance Against the 24h Range
$HBAR trades inside a 24-hour range of $0.07011 to $0.07395, per CoinGecko data from 08:47 UTC. That leaves price 4.5% above the daily low and 1.0% below the daily high.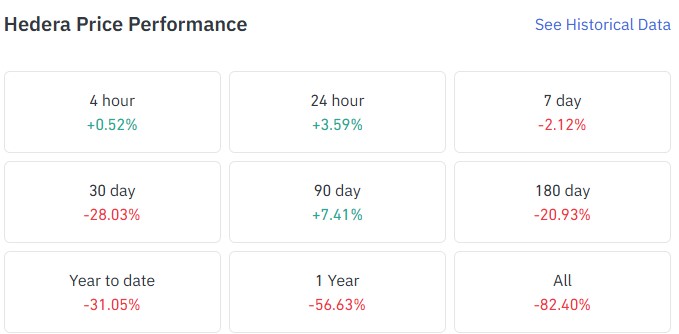
Source: CoinGlass, Hedera price performance panel, November 5, 2026, 08:47 UTC
The panel shows +3.59% over 24 hours and -2.12% over 7 days. Over 30 days, the -28.03% change implies $HBAR traded near $0.1018 a month ago.
HBAR ETF Flows: Canary HBR Adds $2.73M
SoSoValue ETF data as of Nov 4, 2026, shows the Canary HBR ETF took in $2.73M of net inflow, meaning money entering minus money leaving. That equals 37.98M $HBAR, captured on Nov 5, 2026, 08:47 UTC.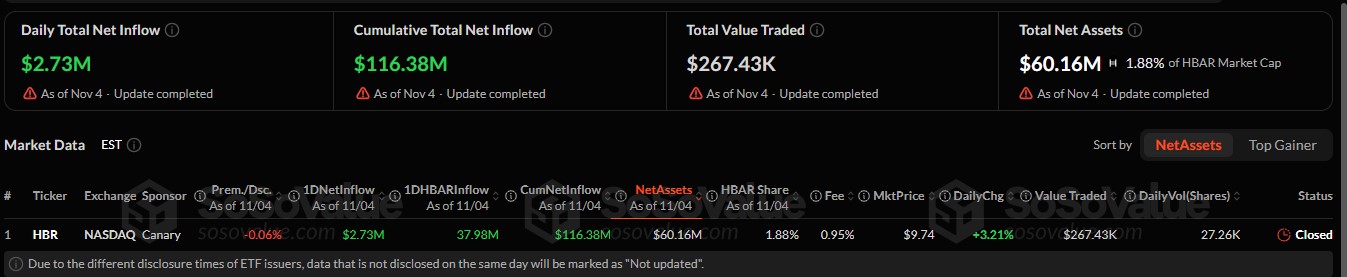
Source: SoSoValue, $HBAR ETF data as of Nov 4, 2026, captured November 5, 2026, 08:47 UTC
Cumulative net inflow stands at $116.38M. ETF net assets, the total value of HBAR the fund holds, are $60.16M, or 1.88% of $HBAR market cap. HBR shares trade at $9.74, a 0.06% discount to the coins held.
$HBAR ETF flows read as steady demand. Actually, the $2.73M inflow equals only 0.08% of market cap. For related updates, see the latest crypto news.
HBAR Open Interest and Futures Volume by Exchanges
Open interest is the total value of futures contracts still open, meaning bets not yet settled. CoinGecko lists perps, futures with no expiry date, at $216.199M of $HBAR open interest as of 08:47 UTC on Nov 5, 2026.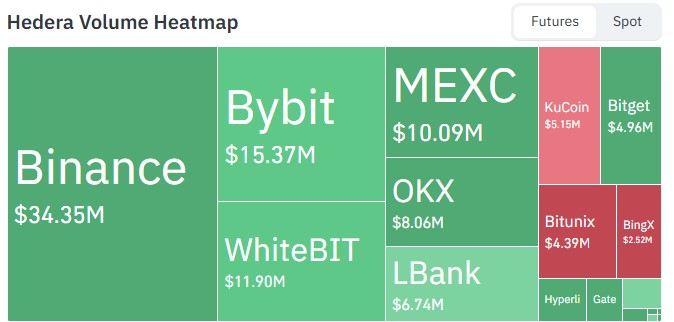
Source: CoinGlass Data, Hedera futures volume heatmap, Nov 5, 2026, 08:47 UTC
On the heatmap, Binance shows the largest futures volume at $34.35M. Bybit follows at $15.37M, and WhiteBIT at $11.90M. The ten exchanges with labeled volume add up to $103.53M.
HBAR Technical Analysis: 1-Day Timeframe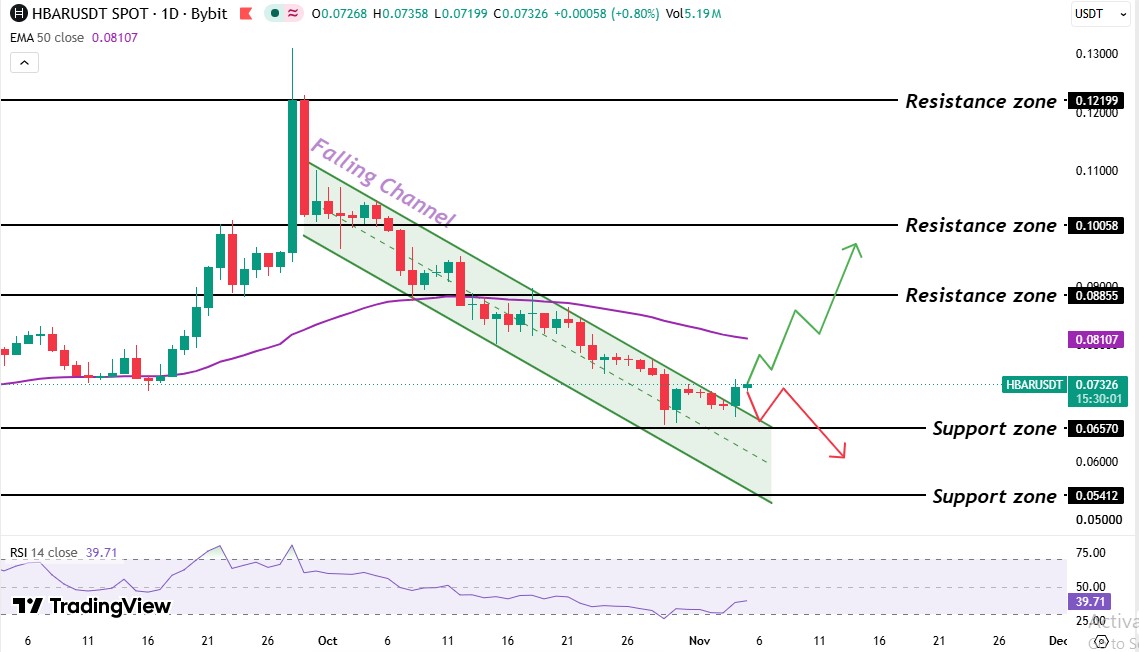
Source: TradingView, HBARUSDT 1D, Nov 5, 2026, 08:47 UTC
The Bybit 1-day chart for HBAR/USDT on TradingView, captured Nov 5, 2026, 08:47 UTC, frames this Hedera price prediction. A sharp September rally pushed HBAR to about the $0.13 level before sellers took over.
After the spike, the price slid inside a falling channel, a falling trendline, and a line joining the highs, which capped every bounce. The market tried many times to break it, but sellers defended the upper channel trendline.
By mid-October, the price slipped under the $0.08107, the 50-EMA level, an exponential moving average of recent prices where sellers have defended before. Late October brought a drop to the $0.06570 support zone, where buyers have stepped in. A bounce followed, and the latest daily candles pushed above the channel's upper trendline.
Right now, the price trades above the $0.06570 support zone and the trendline but below the 50 EMA. For wider context, see the latest crypto market news.
The $HBAR 50-day EMA sits at $0.08107, and HBAR's $0.07326 price trades 9.7% below it. Today's daily candle trades below it too. a real recovery needing a price above it.
The $HBAR RSI reads 39.71 on the 14-day setting. A reading under 50 means sellers hold the momentum edge. Above 30, oversold conditions haven't formed, so price has room to fall.
HBAR Support and Resistance Levels
Level | Type |
$0.12199 | Resistance zone |
$0.10058 | Resistance zone |
$0.08855 | Resistance zone |
$0.08107 | 50-day EMA |
$0.06570 | Support zone |
$0.05412 | Support zone |
The nearest floor is $0.06570, and the nearest ceiling is the $0.08107 EMA.
Bull, Base, and Bear Scenarios for the Hedera Price Forecast
Scenario | Trigger | Target | Invalidation |
Bull | Daily candle above the $0.08107 EMA level | $0.08855 | Daily candle below $0.06570 |
Base | Price holds $0.06570 to $0.08107 levels. | Range trade | Daily candle leaves the band. |
Bear | Daily candle below $0.06570 | $0.05412 | Daily candle above the $0.08107 level |
The base case fits best in this Hedera price prediction, since price sits about 10% from both the support and the EMA. The next SoSoValue update is the first condition to watch.
Regulatory delay would slow new fund demand. An ETF-flow reversal would remove the $2.73M daily inflow, and a daily candle below $0.06570 would end the base case.
Hedera price prediction: Expert Outlook
As per the CoinGabbar analysis, the Hedera price prediction here favors a pause before any breakout. RSI at 39.71 shows sellers hold momentum. The $2.73M ETF inflow is only 0.08% of market cap.
The channel break is a real first step, and the $0.06570 level was held in late October. But the $0.08107 EMA is the level to monitor, because a daily candle trading above it would show buyers have taken back control.
YMYL Disclaimer: This article is for educational and informational purposes only. It does not offer financial advice, price guarantees, or return promises. Crypto assets are volatile, so readers should research independently before making decisions.