ICP Price Prediction: Can Buyers Reclaim $3.51 Resistance Soon?

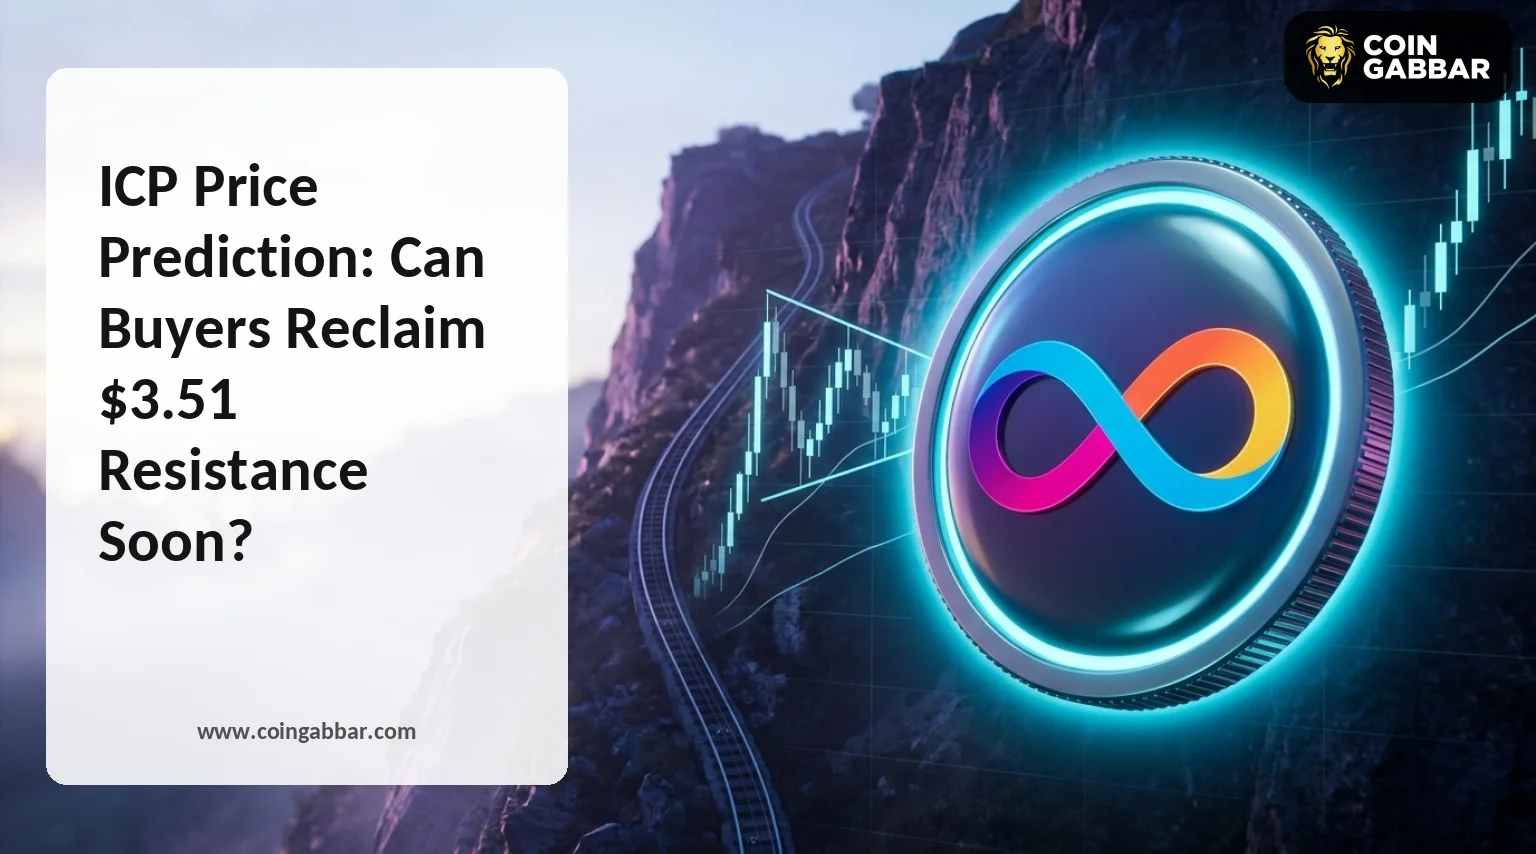
Can ICP climb back to $2.990 after a bounce from the $2.397 support level?
This ICP price prediction begins with Internet Computer (ICP) trading well below its early October highs. Buyers pushed the token higher in late September, and a longer ICP 2026 view adds wider context to that rally. Since then, the price has slid along a falling channel. This ICP price forecast tracks whether buyers can reverse that slope.
Where Does ICP Stand Right Now?
CoinGecko market data ranks Internet Computer 57th with a $1.376B market cap. ICP trades in a 24-hour range, the spread between the day's low and high, from $2.20 to $2.56.
| Metric | Value |
| Price | $2.46 |
| 7-day change | +2.3% |
| 24h range | $2.20 to $2.56 |
| Market cap | $1.376B |
| Market cap rank | 57th |
| FDV | $1.376B |
| 24h volume | $85.1M |
| Circulating supply | 558.968M ICP |
Source: CoinGecko, captured Nov 17, 2026, 04:30 UTC
FDV is the value of every token at today's price. It matches market cap, which is price times circulating supply, because all 558.968M tokens already circulate.
What Does ICP Liquidation Data Show?
CoinGlass liquidation data shows $285.90K wiped out in 24h. Shorts account for $186.65K of that. Longs lost $99.26K. A liquidation is a forced exit from a borrowed-money trade once margin runs out.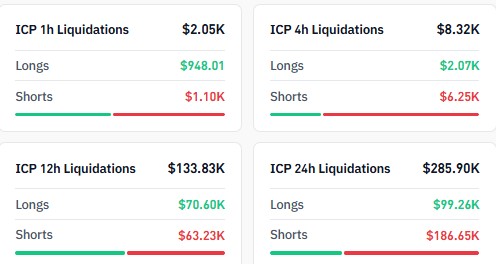
Source: CoinGlass, ICP liquidations, captured Nov 17, 2026, 04:30 UTC
Shorts took $6.25K of the $8.32K total in the latest 4h. The 12h window flipped, with longs losing $70.60K against $63.23K in shorts. And the 1h total stayed small at $2.05K.
Short liquidations are forced buy orders, so $186.65K in shorts forced out adds buy pressure on the way up. But long liquidations add sell orders, and the 12h split shows both sides got hit.
What's Happening With ICP Open Interest?
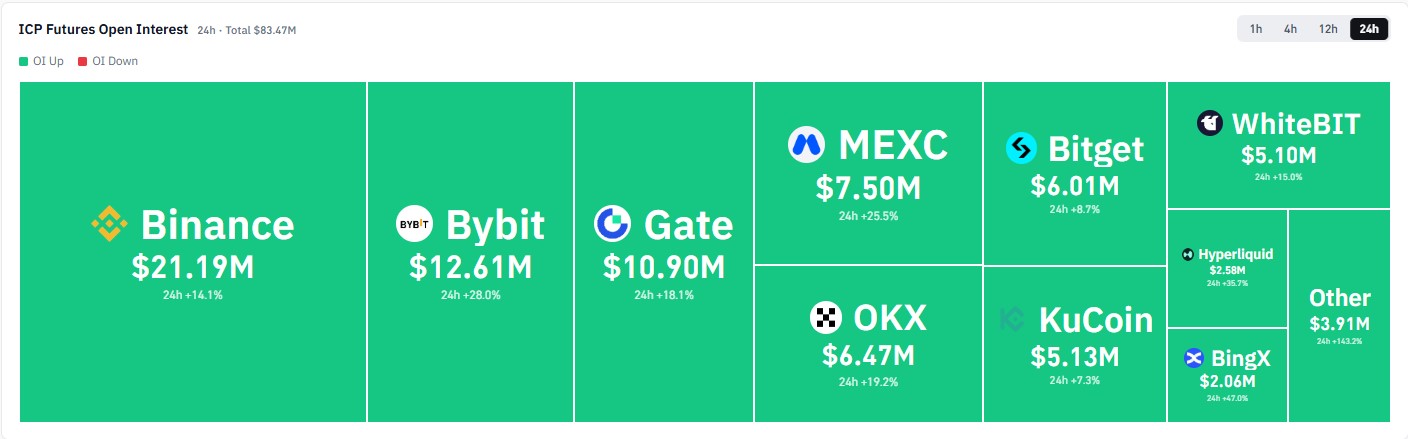
Open interest is the total value of futures contracts still open. Rising figures mean traders are adding positions.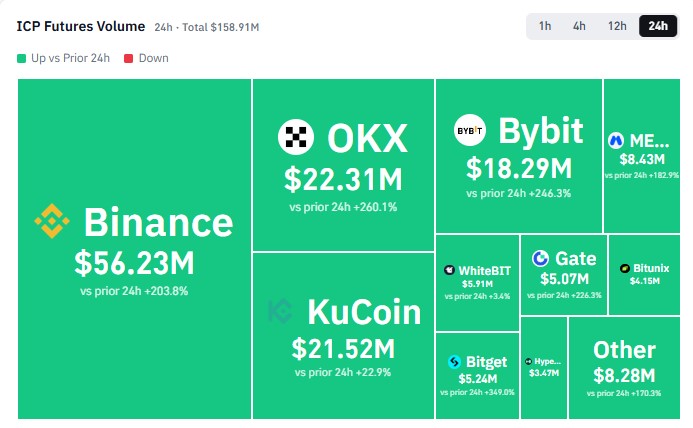
Source: CoinGlass, ICP futures volume by exchange, 24h, captured Nov 17, 2026, 04:30 UTC
Source: CoinGlass, ICP futures open interest by exchange, 24h, captured Nov 17, 2026, 04:30 UTC
CoinGlass futures data shows $158.91M in 24h ICP futures volume and $83.47M in total open interest. CoinGecko lists a different perps figure of $114.095M, so the two trackers don't match.
Why did 24h futures volume on Binance rise 203.8% and on OKX 260.1% while the price stayed under its channel top?
Rising volume reads bullish at first. Actually, volume without a daily candle above $2.639 is only activity, not direction.
Every exchange listed shows 24h growth in open interest, so traders are adding positions inside a falling channel. Traders following the crypto news feed can match headlines against these exchange figures. More contracts open means a break of $2.397 or $2.639 can force more exits.
What Does the Chart Say About This ICP Price Prediction?
The Binance 1D chart for ICP/USDT on TradingView frames this ICP price prediction. A fast rally pushed ICP past the $3.541 resistance level, before sellers took control.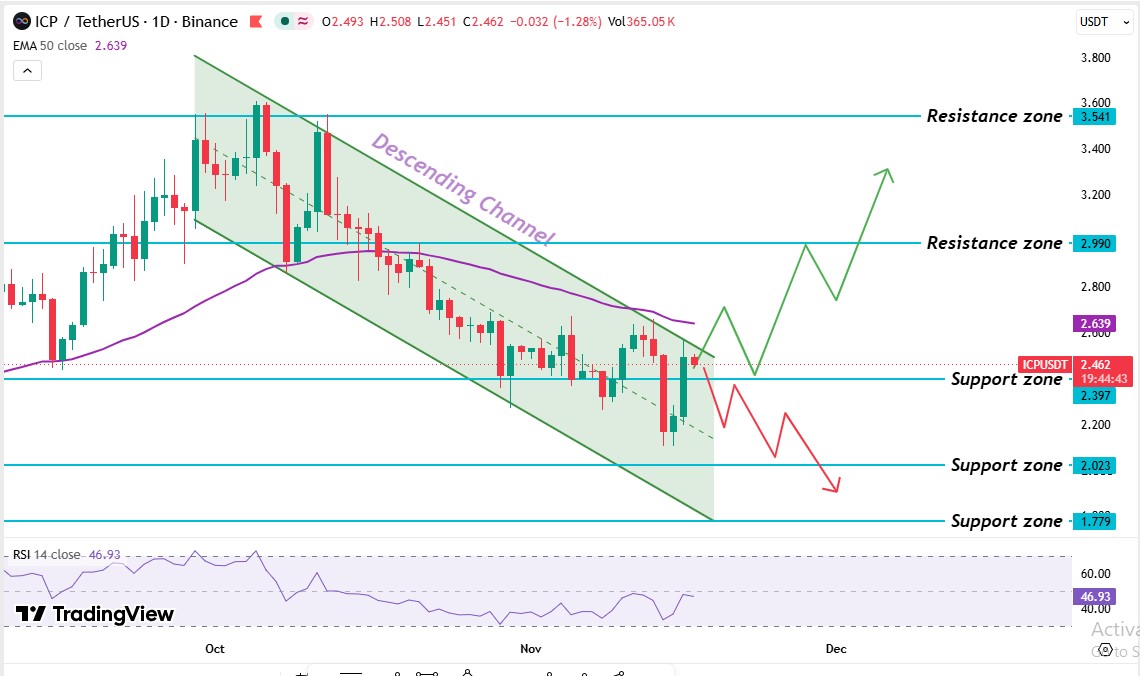
Source: TradingView, ICP/USDT 1D chart with EMA 50 and RSI 14, captured Nov 17, 2026, 04:30 UTC
Price climbed from the $2.397 support level, a price where buyers have stepped in before. It topped near the $3.541 level twice, and buyers failed to hold above it both times. ICP then slid back through the $2.990 level, which flipped from support to a resistance level once it broke. Price lost the 50-day EMA, an average of the last 50 daily prices, as well, and then spent early November testing the $2.397 support level.
A mid-November wick pushed under $2.397, but buyers brought the price back above it. Traders weighing ICP partnership news still need a daily candle above $2.639 to confirm any shift. The falling channel now caps the bounce near the EMA. A break above its upper line signals a trend change, while a break below its lower line extends the slide. Right now, the price trades above the $2.397 support level and below both the $2.990 resistance level and the EMA.
The ICP 50-day EMA sits at $2.639. ICP's $2.46 price trades below it, and the EMA sits 7.3% above that price. The latest daily candle trades below the EMA too. The channel's upper line sits next to it, so a real recovery needs a candle trading above both levels.
The ICP RSI reads 46.93 on the 14-day setting. It peaked near 70 in early October. A reading under 50 means sellers hold the edge. Above 30 means oversold conditions haven't formed, so the price has room to fall.
Support and Resistance Levels
| Level | Type |
| $3.541 | Resistance level |
| $2.990 | Resistance level |
| $2.639 | 50-day EMA |
| $2.397 | Support level |
| $2.023 | Support level |
| $1.779 | Support level |
The nearest ICP support levels sit at $2.397 and $2.023.
Overhead, the $2.639 EMA comes first, then the $2.990 resistance level.
ICP Price Forecast: Bull, Base, and Bear Scenarios
| Scenario | Trigger | Target | Invalidation |
| Bull | Daily candle trades above the $2.639 EMA level | $2.990, then $3.541 | Falls back below the $2.639 level |
| Base | Price stays between $2.397 and $2.639. | Sideways trade in that range | Daily candle breaks either level. |
| Bear | Daily candle trades below $2.397 | $2.023 then 1.779 | Daily candle trades above $2.639 |
Risks to this ICP price prediction sit on both sides of the band. Regulatory delay can stall a news-led bounce, and a 2.3% weekly gain is thin enough to reverse fast. Technical invalidation matters most. A daily candle trading below $2.397 sends the price toward $2.023.
Can ICP Reach $4 From Here?
ICP would need a 62.6% gain to reach $4. Price first needs a daily candle above $2.639. After that, the $2.990 and $3.541 resistance levels stand in the way.
The early October peak stayed below $4 on the chart. Rising open interest shows traders are adding positions, but a bounce toward $4 still starts with the $2.639 50-day EMA Flip.
What Is the Expert Outlook on ICP Levels?
According to CoinGabbar analysis, the ICP price prediction leans bearish while the price trades below the $2.639 50-day EMA. Sellers hold the edge with RSI at 46.93, and the falling channel still points lower.
A daily candle above $2.639 would flip that read. Until then, traders should watch the $2.397 support level, and a daily candle trading below it puts $2.023 in play.
Disclaimer: This article is for information only and isn't financial advice. Traders should do their own research and risk only what they can afford to lose.