Bless Price Prediction: Is the $0.02 Rejection a Bull Trap?


Can Bless hold its footing after a 42.84% daily reversal from $0.02?
Buyers pushed BLESS to $0.02 on the daily chart, then sellers sent it back to $0.01074 inside the same candle, a bar covering a day of trading. That leaves this Bless price prediction resting on a rejected level, and the earlier Bless price move showed how fast this token swings.
Bless Price Prediction Data Snapshot
BLESS price today is $0.01076, at 06:10 UTC on Nov 17, up 15.86% in 24 hours, and it ranked 479th on CoinMarketCap data.
Market cap, meaning price times circulating coins, is $28.83M. Fully diluted value, the cap if all 10B coins are traded, is $107.64M.
Volume hit $34.35M, up 1220%, or 117.14% of market cap. That's heavy turnover for a token this small.
And the price is still 95.29% under the all-time high of $0.2221.
Why Is BLESS Moving Today?
BLESS futures volume hit $960.45M, up 3273.85%, against $11.11M in spot. That's 86.5 times more.
BLESS open interest, the total value of open contracts, rose 39.04% to $38.13M on CoinGlass futures data.
Liquidations, forced closures of leveraged trades, hit $4.84M, split between $2.39M in longs and $2.45M in shorts. Funding rate, the fee longs and shorts pay each other, is -0.0134%, so shorts are paying longs.
A 15.86% gain looks bullish. Spot net inflow was only $63.9K.
BLESS Technical Analysis
Daily Chart Analysis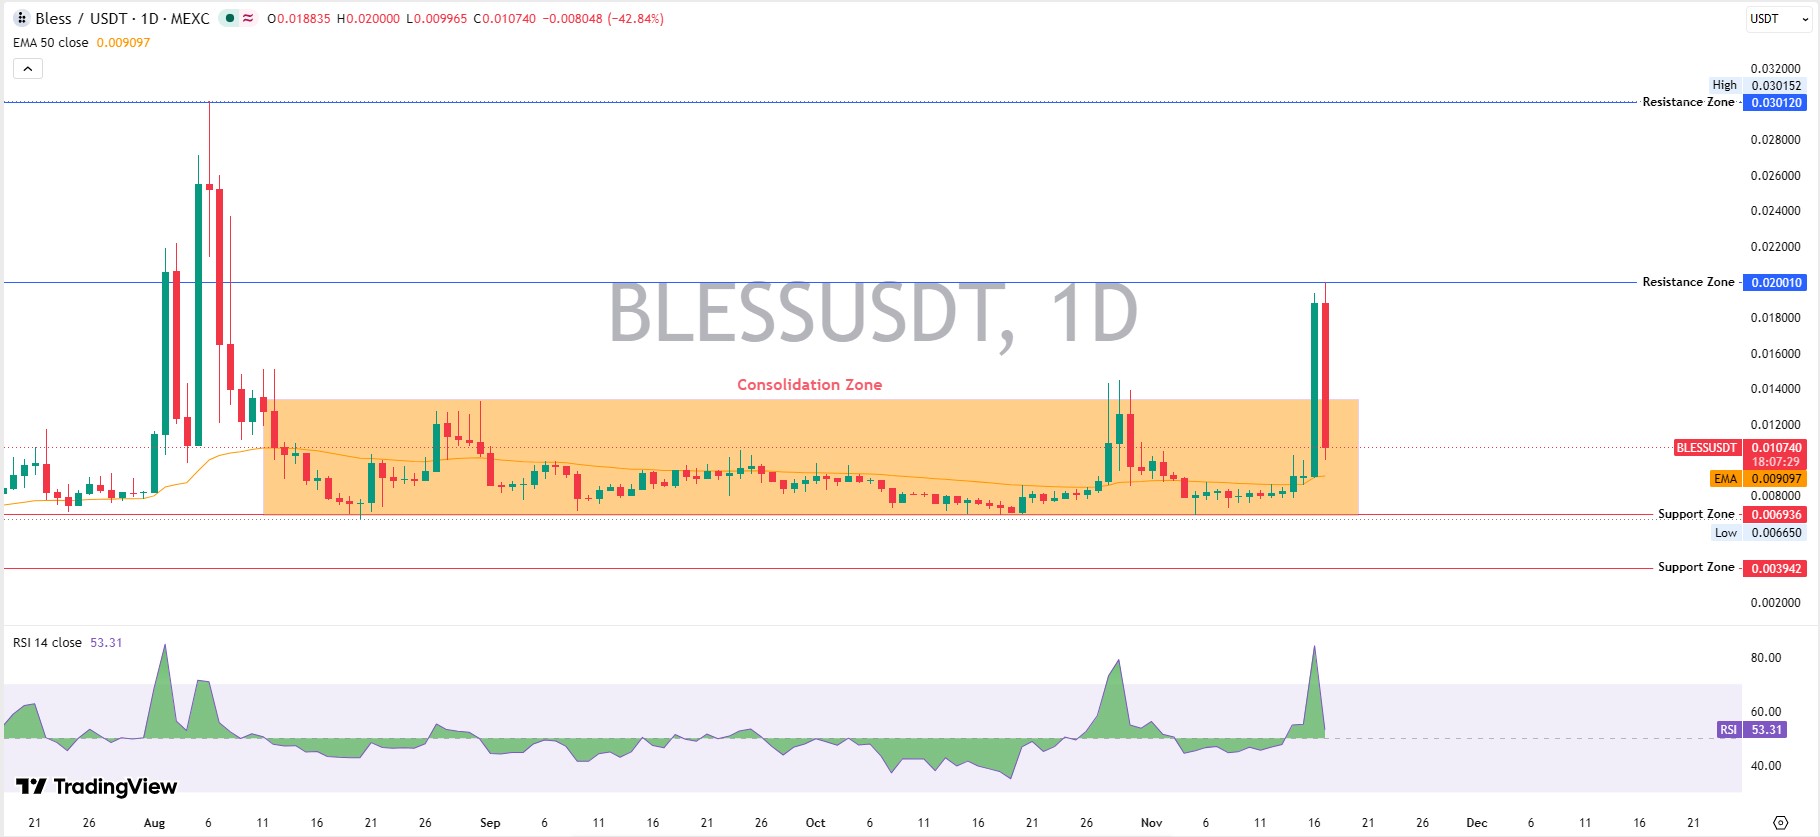
Daily candles show the faster story. Price spiked to $0.030152 early on, then dropped into a consolidation zone, a sideways band, with $0.006936 as the floor.
The price was in a consolidation zone around the 50 EMA at $0.009097 for about 3 months.
The newest rally was bigger. A large green candle pushed past $0.0180 with RSI near 85.
Next came a candle that opened at $0.018835, hit $0.020000 right under the $0.020010 resistance, the level where sellers cap rallies, and dropped to $0.009965. It trades at $0.010740 now, down 42.84%, with RSI back at 53.31.
Sellers were waiting. Right at $0.02. But the 50 EMA at $0.009097 is still the next real floor.
Weekly Chart Analysis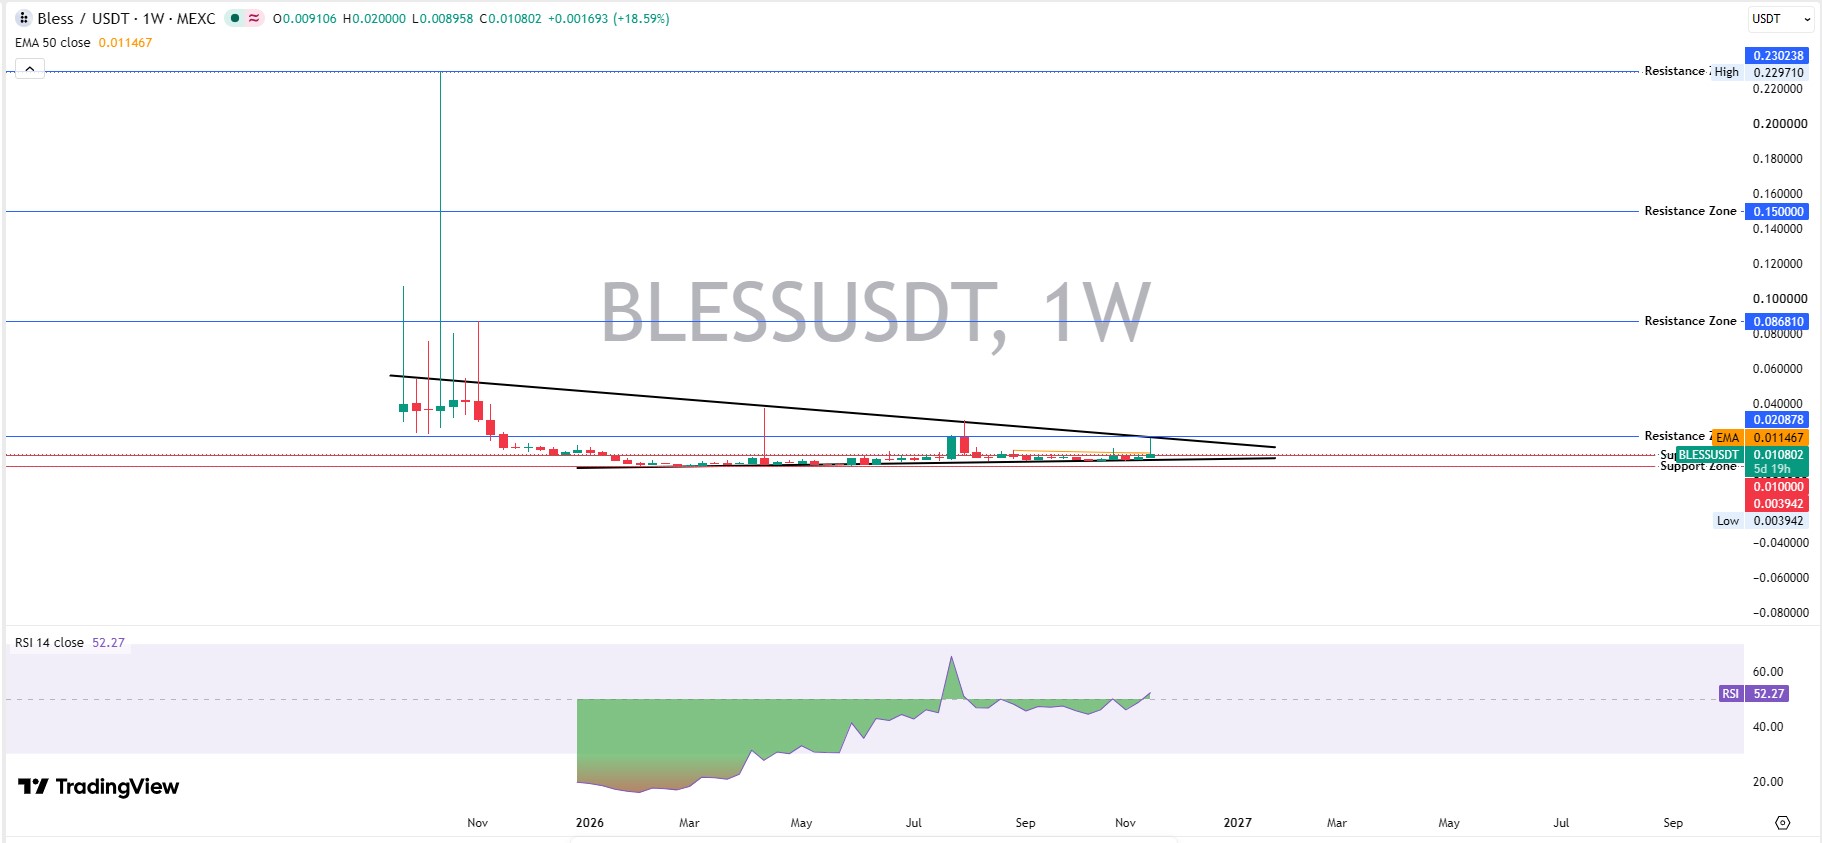
BLESS technical analysis starts at the peak, where a wick, the thin line marking a price extreme, hit $0.229710. Weeks of selling followed. Then a base, right at $0.003942.
A falling trendline, a line joining lower highs, has capped every rally since and now runs near $0.0200. A flat floor underneath squeezes price into a tight triangle.
RSI jumped to about 66 on a green weekly candle midway through the pattern. Price drifted back to $0.0100 and sat there.
This week's candle opened at $0.009106 and dipped to $0.008958. Then it ran to $0.020000, tagged the triangle top, and slid to $0.010802, up 18.59% on the TradingView weekly chart.
RSI is 52.27, neutral. The 50-week moving average, the mean price of the last 50 weeks, is $0.011467 and sits above the price. That's a rejection at the triangle top, not a breakout, which means a clean push through it.
Who Holds Most BLESS Tokens?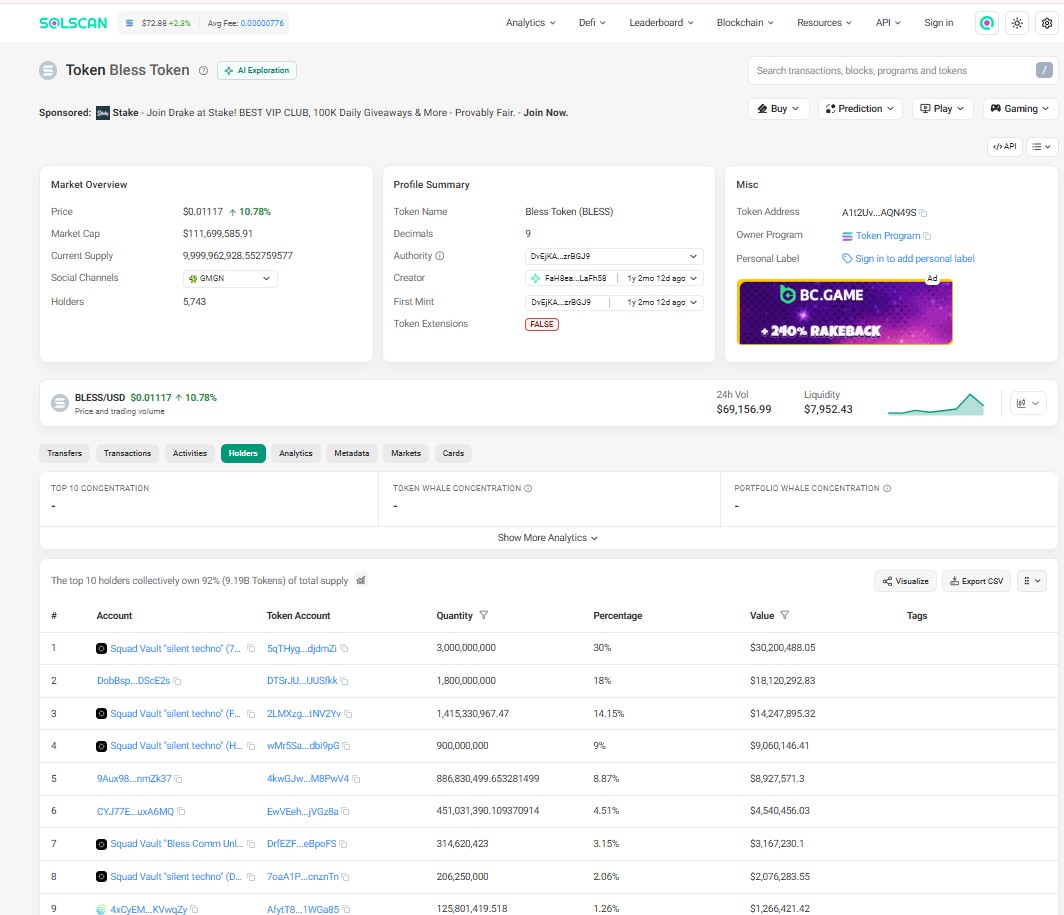
The top 10 wallets hold 92% of supply, or 9.19B tokens, per Solscan holder data. The largest, a Squad Vault, holds 3B tokens, a 30% share.
That BLESS whale concentration leaves the price at the mercy of a few wallets. Only 2.67B tokens circulate, so most of that stash isn't trading yet. And any unlock-hitting exchanges add supply fast.
BLESS Support and Resistance Levels
Support, the area where buyers step in, starts at $0.01 on the weekly chart. Below it sit $0.009097, $0.006936, and the $0.003942 zone.
Overhead, the BLESS support and resistance map starts with the 50 EMA at $0.011467. $0.020010 and $0.020878 follow, and $0.030120 and $0.086810 sit far above.
BLESS carries a DePIN tag, short for decentralized physical infrastructure, so sector headlines like AI crypto news can move volume.
BLESS Price Forecast Scenarios
Can BLESS reach $0.03? Futures traders act like it, with Binance long accounts at a 1.7020 ratio to shorts. But spot buyers haven't followed.
Liquidity, how easily coins trade without moving price, is thin at 0.95% of market cap, so this BLESS price forecast depends on spot volume.
Scenario | Trigger | Target | Invalidation | Liquidity Condition |
Bull | Daily trade above $0.0200 | $0.0301, then $0.0868 | Back under $0.0200 | Spot volume rising |
Base | Range $0.0100 to $0.0200 | $0.0115, then $0.0200 | Trade under $0.0100 | Futures lead, spot flat |
Bear | Weekly trade under $0.0100 | $0.0091, then $0.0069 | Reclaim of $0.0115 | Longs liquidated, funding negative |
Long-Term BLESS Price Outlook
This Bless price prediction stays cautious beyond the next few weeks. The weekly chart still makes lower highs under the triangle top.
A weekly trade above $0.020878 breaks the falling trendline and opens $0.086810. Under $0.01, the price heads toward $0.003942.
Unlocks decide the rest, and the Bless whale holder research maps the wallets worth tracking.
Risks That Could Change the Outlook
Open interest is 131.53% of market cap, so futures dwarf the token itself. A few forced liquidations can move the price fast. And extreme fear at 13 means traders are nervous.
A new listing or delisting can change access overnight, so exchange listing updates deserve a check before any trade.
Final Takeaway
Under this Bless price prediction, bias stays bearish below $0.02 because two charts rejected it. A weekly trade under $0.01 puts $0.009097 and $0.006936 in play.
Traders comparing setups can browse other crypto price predictions.
Disclaimer: This article is for information only and isn't financial advice. Crypto prices swing fast, and BLESS is a small-cap token with thin liquidity. Readers should research before trading and never risk money they can't afford to lose.