INFI Price Prediction: How Far Is FDV From the $73.495M TVL?

The Token Slips 31.5% as Valuation Trails Locked Deposits
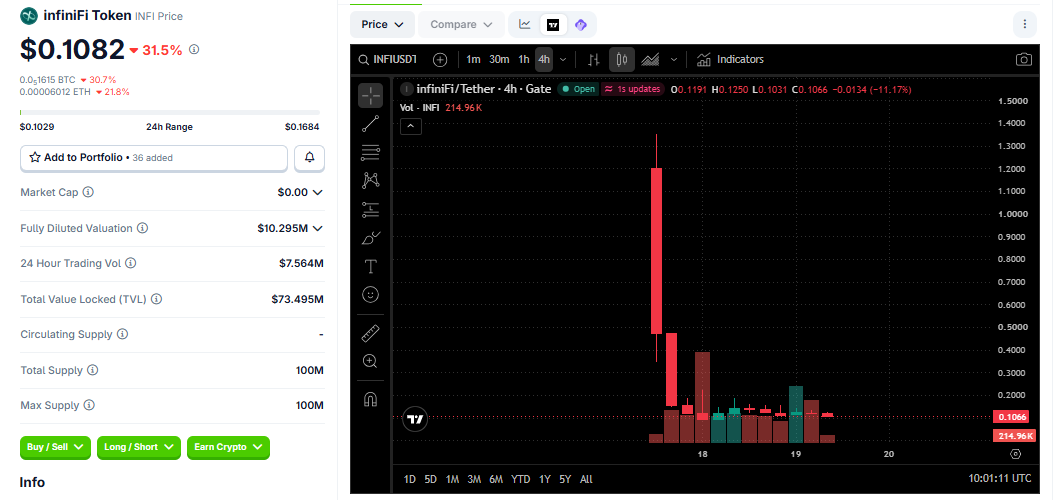
A wide gap between two numbers now shapes the INFI price prediction. CoinGecko data from Nov 19, 2026 shows the asset near $0.1082, down 31.5% in a day.
The protocol holds $73.495M in total value locked (TVL), while the token carries a $10.295M fully diluted valuation (FDV).
This report tests that gap against the Gate four-hour chart and sets out three scenarios through Dec 19, 2026.
What the Nov 19 Data Shows for Valuation and Volume
TVL counts the funds users place in the protocol. According to the infiniFi docs, depositors who add USDC receive iUSD, a receipt token. Those funds belong to users, not to holders of the asset.
Metric | Reading on Nov 19, 2026 |
Quote | $0.1082 |
24h change | -31.5% |
24h range | $0.1029 to $0.1684 |
FDV | $10.295M |
24h volume | $7.564M |
TVL | $73.495M |
Total supply | 100M |
FDV equals about 14% of TVL.
Volume over 24 hours equals about 73% of FDV.
The quote sits about 5% above the daily low.
CoinGecko lists no market cap or circulating figure yet. These readings frame the INFI price prediction below.
Source: CoinGecko Chart
Note: Prices can change quickly, so figures may not reflect the latest value. Readers should check a live price tracker for current data.
INFI Price Prediction Levels on the Gate Four-Hour Chart
The chart was read at 10:01 UTC on Nov 19. It shows a tall red candle from the launch spike, then a second sharp drop. Candles have stayed small since.
The latest candle opened at $0.1191 and reached $0.1250. It fell to $0.1031 and closed at $0.1066, down 11.17%.
Support: $0.1031 (latest candle low), close to the $0.1029 daily low.
Resistance: $0.1250 (latest candle high), then $0.1684 (daily high).
Round level: $0.20, where the second drop candle ended.
Three Scenarios Through Dec 19, 2026
This INFI price prediction uses three ranges. Each converts to valuation by multiplying the quote by 100 million units. The ratio column divides that value by the $73.495M of locked funds.
Scenario | Range | Valuation | Ratio to TVL | Change from $0.1082 |
Bear | $0.07 to $0.10 | $7M to $10M | 0.10x to 0.14x | -35% to -8% |
Base | $0.10 to $0.15 | $10M to $15M | 0.14x to 0.20x | -8% to +39% |
Bull | $0.17 to $0.25 | $17M to $25M | 0.23x to 0.34x | +57% to +131% |
The bear case needs a close below $0.1029. That would break the daily low and show buyers stepping back.
The base case assumes the quote holds above that low. Rallies stall near $0.1250 while volume stays close to current levels.
The bull case needs a close above $0.1684, the daily high. That would bring the round $0.20 level into view, provided volume holds near $7.564M or higher.
Why Locked Deposits Matter for the Outlook
Several factors link TVL to the INFI price prediction, though none is a direct driver.
Different owners: TVL belongs to depositors, while FDV values the token. The two can move apart.
Revenue link: The whitepaper outlines the treasury is financed by a small fee on interest. It gives no rate.
Moving funds: Users can add or withdraw funds, so the ratio shifts even when the quote stays flat.
Float: No circulating figure is listed, so the tradable amount stays unclear.
Expert Opinion on the Valuation Gap and Volume
A ratio of 0.14x shows the market values the asset far below the funds the protocol holds. That alone does not make it cheap or costly, because depositors own those funds.
High turnover can mean two things. Buyers may be building positions, or holders may be exiting. The data cannot tell which.
A close above $0.1250 on steady volume would favor the first reading. A close below $0.1029 would favor the second. Every range in this INFI price prediction is a scenario, not a forecast of certain outcomes.
Conclusion: Levels and Ratios to Track Into December
The INFI price prediction rests on support near $0.1029, resistance at $0.1250 and $0.1684, and the ratio of FDV to locked funds.
Volume and fund flows will show which scenario fits best. Readers can follow official infiniFi channels and a live tracker for updates.
Disclaimer: This article is for information only and is not financial advice. Cryptocurrency assets are volatile and can lose value quickly. Price scenarios are estimates, not predictions of certain outcomes or guaranteed returns. Verify official announcements and contract details before making any financial decision.
















