Ethereum Price Prediction: ETH Holds $1,800 as Fed Hike Fears Grow


ETH trades near $1,807, down 0.36% in 24 hours, with the daily RSI at 27.56.
US spot ETH ETFs recorded $39.83 million in net outflows on November 18.
Bulls need to defend $1,700 to $1,730. A daily close below $1,700 puts $1,600 in focus.
Ethereum (ETH) is holding just above $1,800 on Thursday. The coin moved between $1,731.4 and $1,813.0 over the last 24 hours.
Sellers still run the daily chart. The Fed minutes added fresh pressure, and the next move depends on whether $1,700 holds.
Lets discuss the Ethereum Price Prediction
Fed minutes keep the pressure on ETH
The Federal Reserve released the minutes of its October 27-28 meeting on November 18. Policymakers kept rates unchanged, after a hike in September.
Lisa Cook and Beth Hammack dissented. Both wanted a quarter-point hike as early as October.
Almost all participants said more rate hikes would likely be right to bring inflation back to 2%. A couple of members even saw a move bigger than 25 basis points as possible if inflation data comes in hot. A basis point is one hundredth of a percentage point.
The next meeting is on December 8 and 9, with new projections. Higher US rates make safe assets more attractive. That can pull money out of volatile markets like ether.
Futures data shows fear, not hope
Derivatives data leans bearish for now. Futures volume fell 7.95% to $32.93 billion. Open interest rose 1.83% to $23.46 billion.
In simple terms, traders are still opening positions even as trading slows down.
Liquidations hit $82.93 million in 24 hours. Longs took $60.24 million of that, while shorts lost $22.69 million. Bulls got hurt more.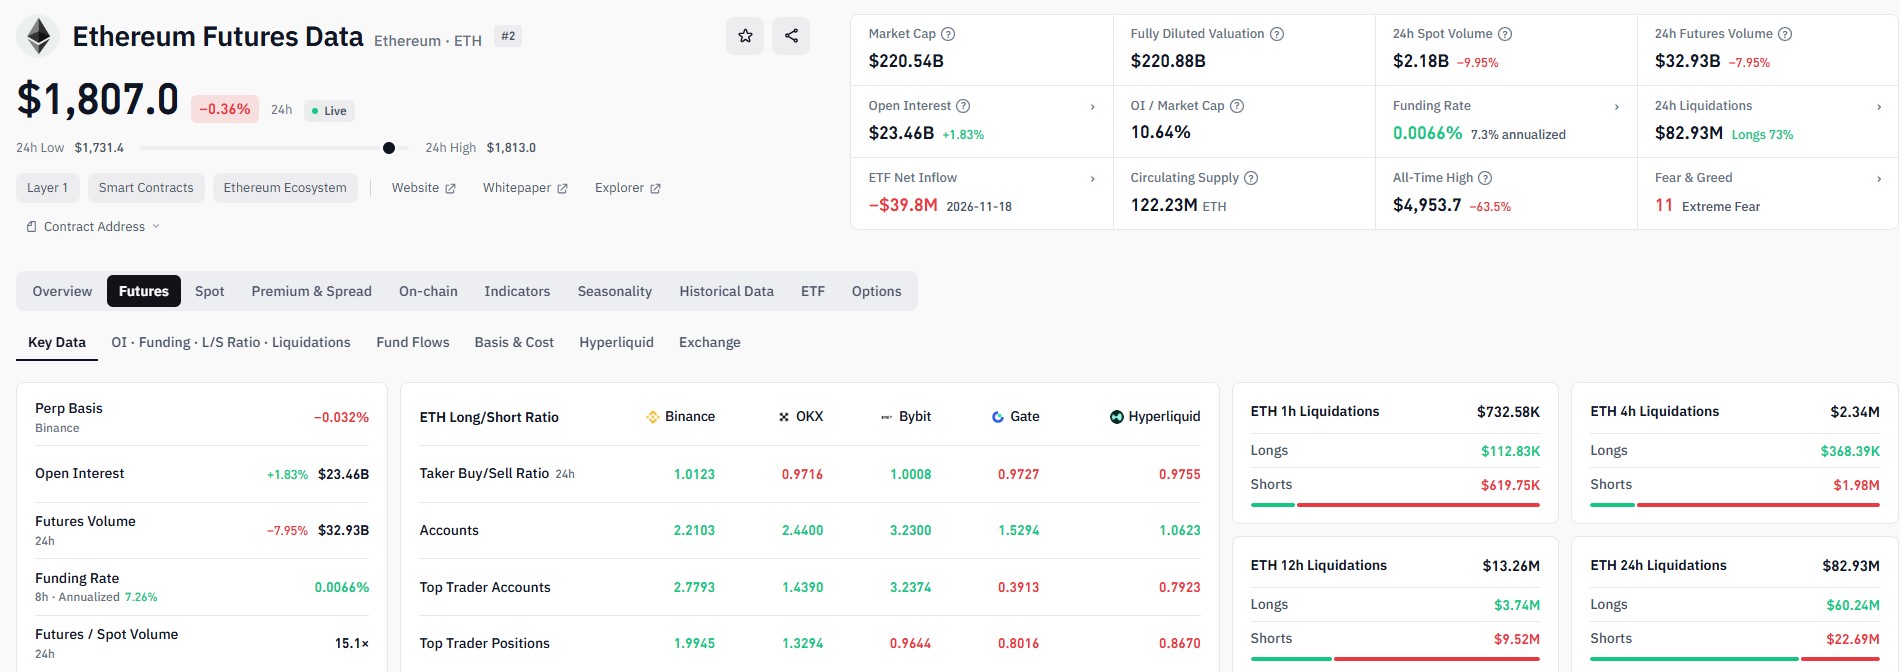
The Fear and Greed Index sits at 11, which signals extreme fear. The funding rate is a small positive 0.0066%.
ETF flows turn red
US spot ETH ETFs recorded a net outflow of $39.83 million on November 18. BlackRock's ETHA lost $17.42 million. Grayscale's ETH lost $15.04 million.
Even so, total net inflows since launch still stand at $11.44 billion. Net assets are $9.68 billion, about 4.51% of ether's market cap.
More outflows could add pressure in the short term. A return of inflows would be a better sign for the bulls.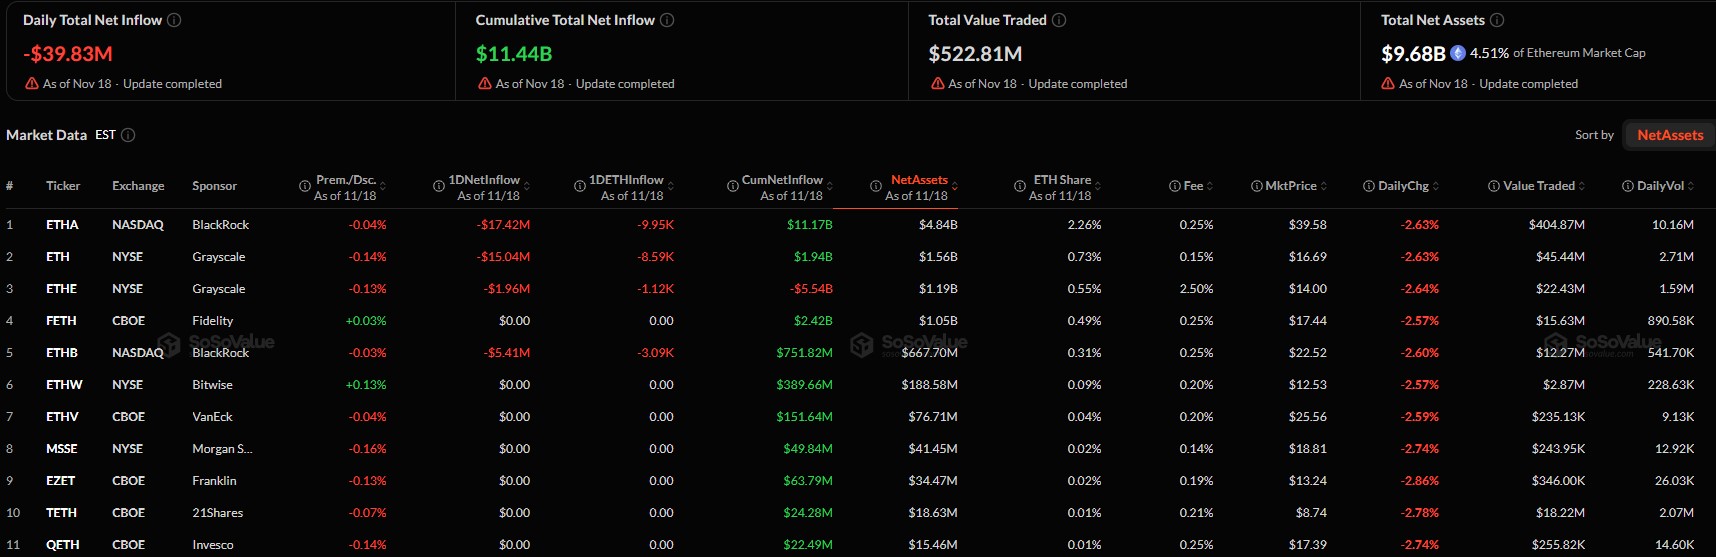
Ethereum price prediction: $1,700 is the line in the sand
On the daily chart, ETH faced rejection near the $2,700 to $2,800 zone. It then slid below all four major moving averages.
EMA | Level |
20-day | $2,021.25 |
50-day | $2,208.98 |
100-day | $2,255.30 |
200-day | $2,270.85 |
The RSI is at 27.56, which is oversold. That can allow a short relief bounce. But oversold readings can stay low for a while.
ETH is also sitting near a rising trendline around $1,700 to $1,730. This is the zone bulls need to defend.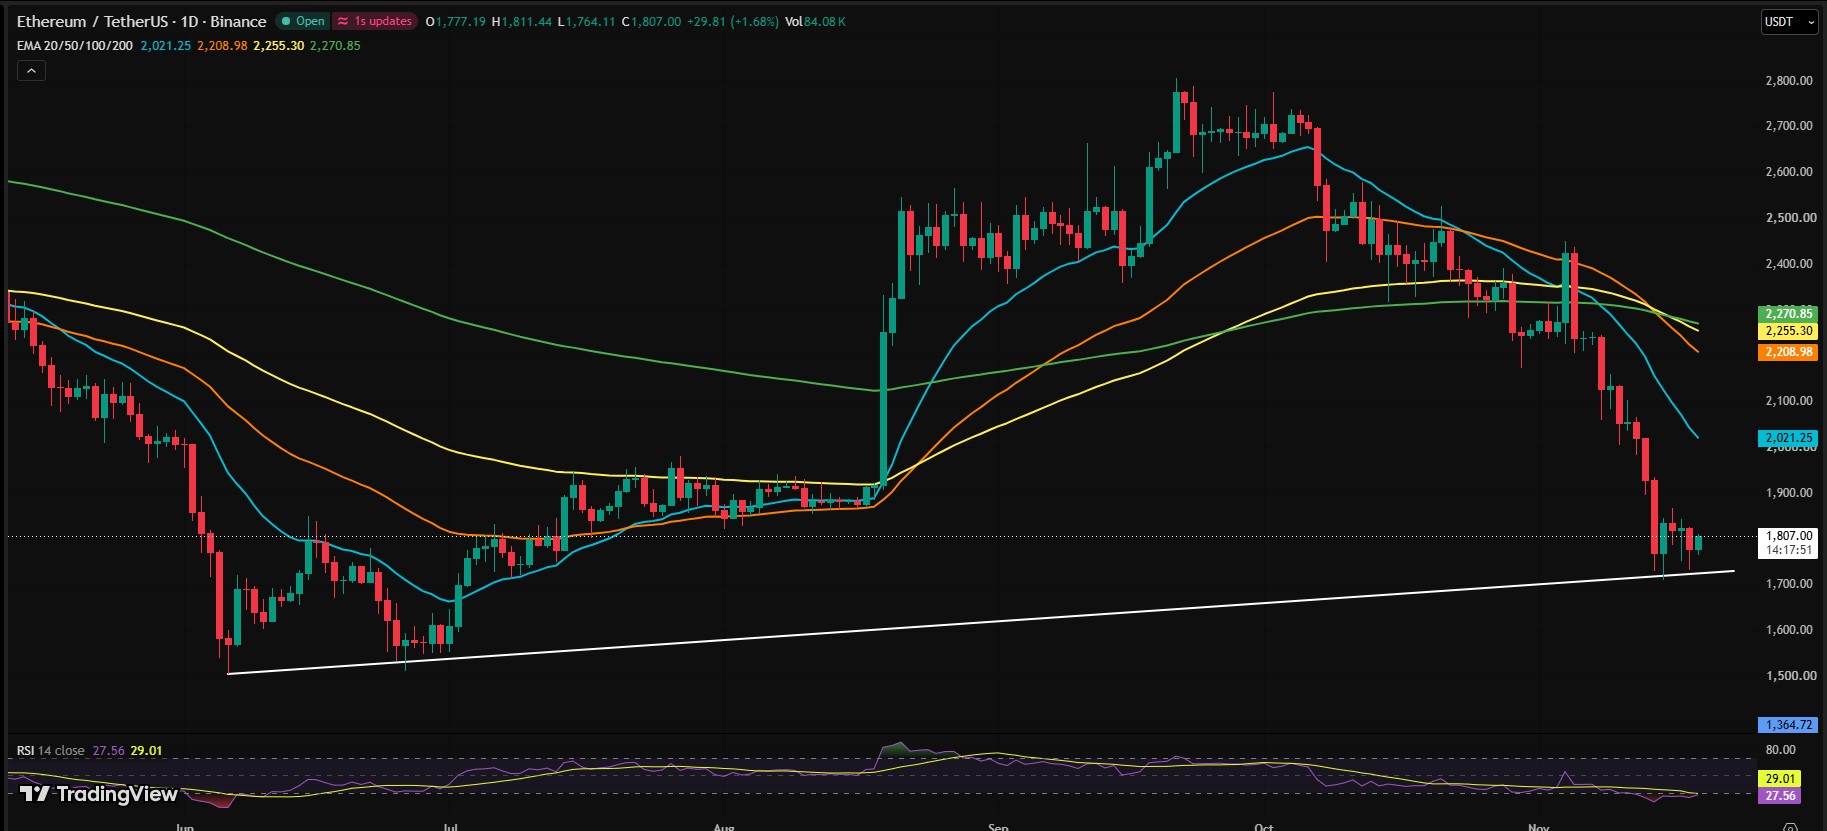
Scenario | Trigger | Possible targets |
Bullish | $1,700 support holds and ETF inflows return | $1,900 to $2,020, then $2,200 |
Neutral | ETH stays between $1,700 and $1,900 until the Fed meets | Sideways range |
Bearish | Daily candle closes below $1,700 | $1,600, then $1,500 |
If support holds, a move toward $1,900 to $2,020 is possible. After that, $2,200 would be the next test.
If a daily candle closes below $1,700, the chart opens room toward $1,600 and then $1,500.
What to watch next
The trend stays bearish until ETH reclaims the $2,020 to $2,200 zone. That is a big gap from today's level.
The December 8 and 9 Fed meeting could shape the mood. ETF flows are another thing to track. Nobody can say how it plays out, and Ethereum may stay choppy until one side wins.
Disclaimer
This article is for information only and is not financial, investment, or trading advice. Crypto assets are volatile and carry a high risk of loss. Price predictions are not guaranteed, and past performance does not guarantee future results. Do your own research and speak with a licensed financial advisor before making any decision. Never invest money you cannot afford to lose.
















