Injective Price Prediction November 2026 as INJ Eyes $9.115 Again


Will INJ hold the $7.397 trend line or slip toward $6.695? That’s the question under Injective Price Prediction November 2026, and it starts with INJ trading at $7.90 after a 7.6% weekly drop on October 27, 2026.
Readers who followed the earlier Injective CEO SEC CFTC meeting coverage will find a different setup now, driven by the chart and derivatives flow.
INJ 24-Hour Market Snapshot
Metric | Value |
Price | $7.90 |
7-day change | -7.6% |
Market cap | $788.708M |
Fully diluted valuation | $788.708M |
Circulating supply | 100M INJ |
Total supply | 100M INJ |
24-hour volume | $115.078M |
Source: Data taken from CoinGecko
INJ trades at $7.90 on October 27, 2026, and since all 100M tokens already circulate, market cap and fully diluted valuation match.
And INJ also featured in an earlier watchlist of altcoins ready to break out on the site.
Injective News Today Brings a Compute Index Launch
Injective announced the Super Intelligence Compute Index (SICI) about 14 hours before, a market built on the price of compute for onchain AI, per the Injective X announcement.
It's fresh news, yet the price still slipped 1.77% on the daily candle, so traders haven't treated it as a trigger, and a new market needs weeks of volume before it matters for Injective Price Prediction November 2026.
Injective Holder Concentration Hits 97.47% 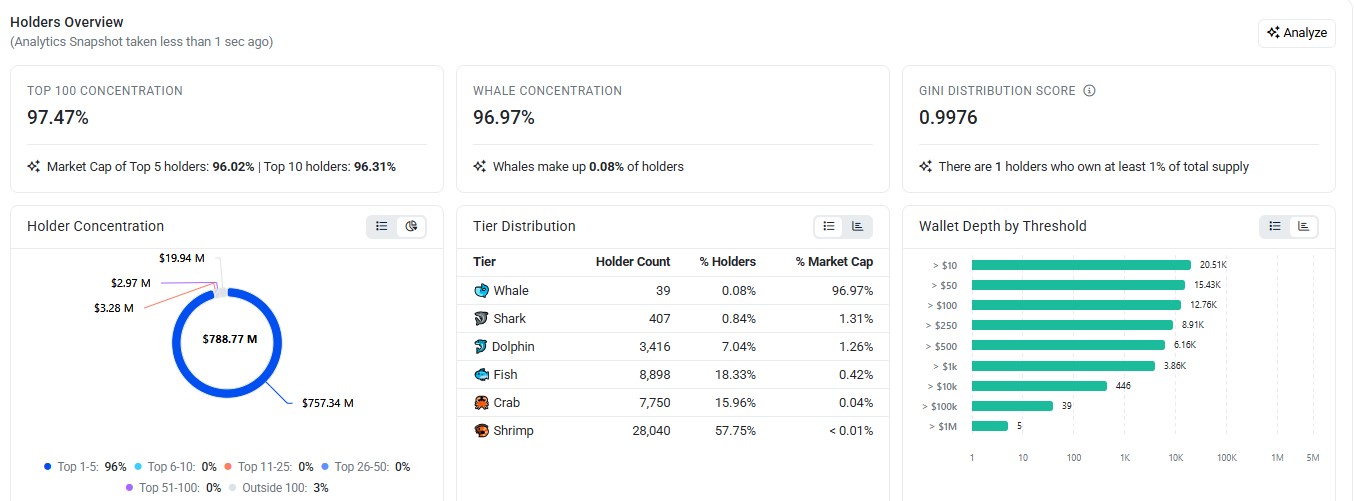
Top 100 concentration reads 97.47%, the top 5 holders control 96.02% of market cap, and the Gini score (a 0 to 1 inequality gauge) sits at 0.9976, which seems alarming. Until the label gets read.
But the Etherscan INJ holder list shows the biggest address is the Peggy Bridge Proxy, holding 94,949,820.587 $INJ worth $748,928,872.14, a bridge contract that locks tokens moved to the Injective chain so that supply sits parked.
Injective Whale Wallets Holders Data
Exchange wallets fill the next ranks, led by the Gemini cold wallet at 600,000 INJ worth $4,732,576.85 and two Bybit wallets near 165,000 INJ each. And exchange balances move fast. Faster than most holders react.
By tier, 39 whales own 96.97% of market cap, while 28,040 shrimp own under 0.01%, so who's left to sell?
Injective Liquidations Hit Longs Hardest in 24 Hours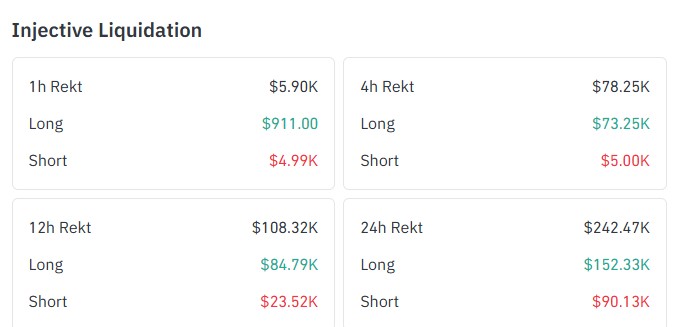
Source: Data taken from CoinGlass
Traders lost $242.47K to forced exits from borrowed-money trades in 24 hours as of October 27, 2026, with $152.33K from longs and $90.13K from shorts.
But shorts took the latest blow, with $4.99K of the $5.90K liquidated in the past hour.
Injective Open Interest and Futures Volume Data
Open interest (the value of all open futures contracts) stands at $370.638M, about 47% of the market cap, while 24-hour trading volume is $115.078M.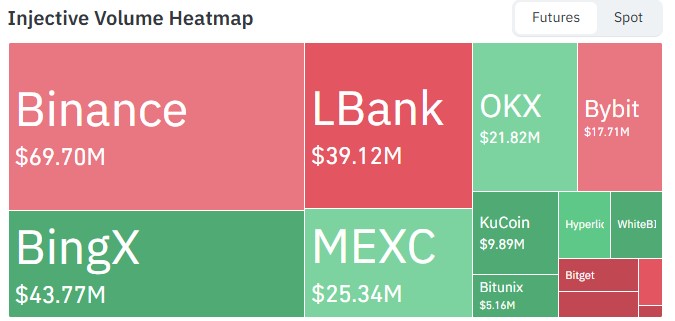
Binance leads futures volume at $69.70M, ahead of BingX at $43.77M and LBank at $39.12M, and the CoinGlass INJ data heatmap puts the 8 exchanges at $232.51M, with Binance near 30% of it.
Injective Technical Chart Analysis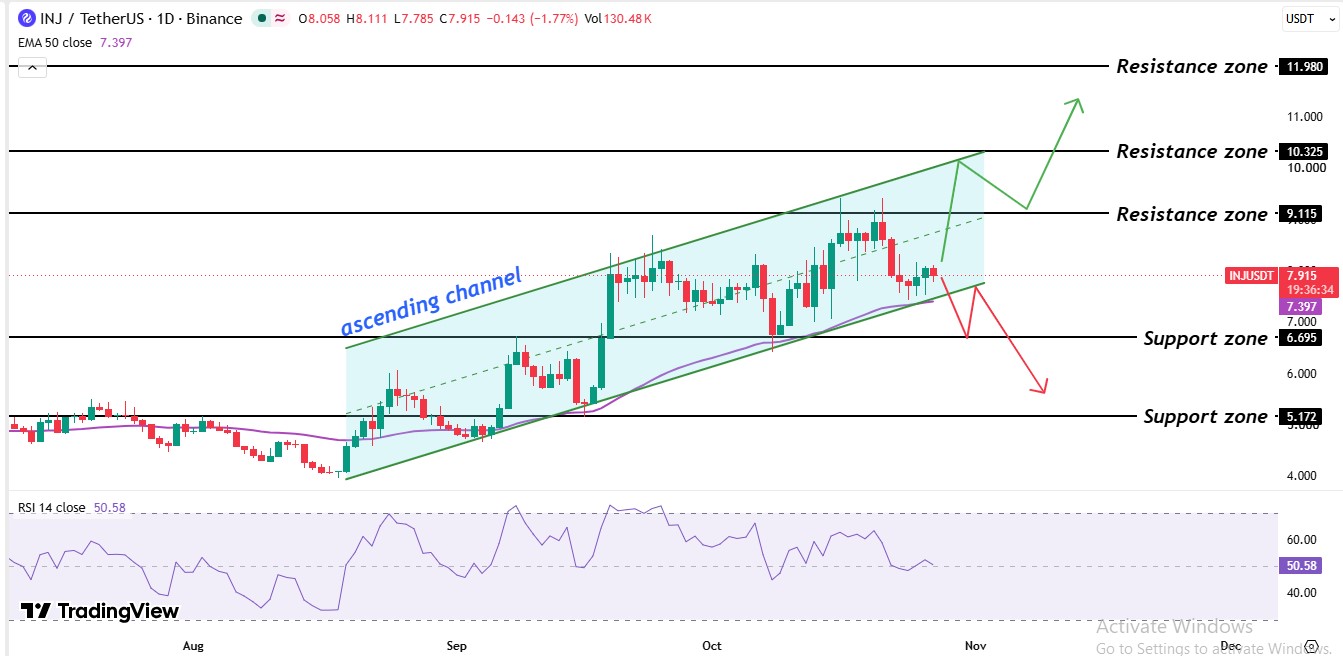
The INJ/USDT daily chart shows consolidation between the $4 and $5 levels in August, then a breakout that started the ascending channel and after that price started making higher highs and lower lows and carried the price toward $9.412 by October.
EMA 50 (the 50-day average price) sits at $7.397 and has acted as a rising floor since August. Price trades about $0.50 above it, so buyers keep the medium trend, and a daily trade under that line hands control to sellers.
RSI (a 0 to 100 momentum gauge) reads 50.58, dead center, after sliding from the low 60s in October. Neither side owns momentum. Not yet, which is why $7.397 and $9.115 matter more than the reading itself.
Injective Support and Resistance Levels
Level | Price | Role |
Resistance | $11.98 | Breakout target |
Resistance | $10.325 | Channel top |
Resistance | $9.115 | October wick zone |
Support | $7.397 | EMA 50 |
Support | $6.695 | Prior swing low |
Support | $5.172 | Breakdown target |
Injective Price Forecast: Bull, Base, and Bear Scenarios
Scenario | Trigger | Target | Invalidation |
Bull | Daily trade above $9.115 | $10.325, then $11.98 | Trade under $7.397 |
Base | Channel floor and $7.397 hold | $9.115 | Trade under $7.397 |
Bear | Daily trade under $7.397 | $6.695, then $5.172 | Trade back above $9.11 |
Injective Price Prediction November 2026: Expert Outlook
As per CoinGabbar analysis, Injective Price Prediction November 2026 leans mildly bullish. It read bearish at first, or so it seemed, until the price held above the EMA 50 inside an intact channel.
A reclaim of $9.115 opens $10.325, a daily trade under $7.397 flips the call toward $6.695, and daily crypto news will show which side wins.
Disclaimer: This article is for information only and isn't financial advice. Crypto assets are highly volatile, and prices can move sharply in either direction. Readers should do independent research and consider their own risk tolerance before making any decision.



















