JPMorgan Bitcoin Forecast Why Bitcoin Could Outperform Stocks and Gold


JPMorgan Bitcoin Forecast 10% Yearly Return Beats U.S. Stocks and Gold
Wall Street’s biggest bank has just given crypto a new kind of attention. In its latest long-term outlook, J.P. Morgan Asset Management has, for the first time, put a return range on BTC.
This JPMorgan Bitcoin Forecast says the digital asset could compound at 10% a year over the next 10 to 15 years, ahead of U.S. large-cap stocks, gold and U.S. REITs.
Here is what the numbers say, what they leave out, and how to read them without confusion.
What J.P. Morgan Asset Management Released
The 2027 Long-Term Capital Market Assumptions is the 31st annual edition of the firm’s flagship outlook.
It gives return, volatility and correlation estimates for more than 200 asset classes across over 20 base currencies. The time frame is 10 to 15 years, and the data is as of September 30, 2026.
The firm says the assumptions are built for strategic, policy-level planning, not short-term trading calls.
This year’s report centers on three forces: economic nationalism, faster technology adoption and what the firm calls capital rewiring.
The same page lists a “first look at bitcoin” as one of its headline updates, alongside upgraded forecasts for U.S. stocks and bonds.
The backdrop matters too. The firm expects a global investment surge centered on AI to lift productivity, pushing its U.S. real GDP growth forecast to 2.1%.
It also raised its U.S. large-cap equity forecast by 80 basis points, to 7.5%, citing profit margins above 15%. Against this strong but uneven background, the new crypto estimate stands out even more.
Bitcoin Price Today: Where BTC Trades Right Now
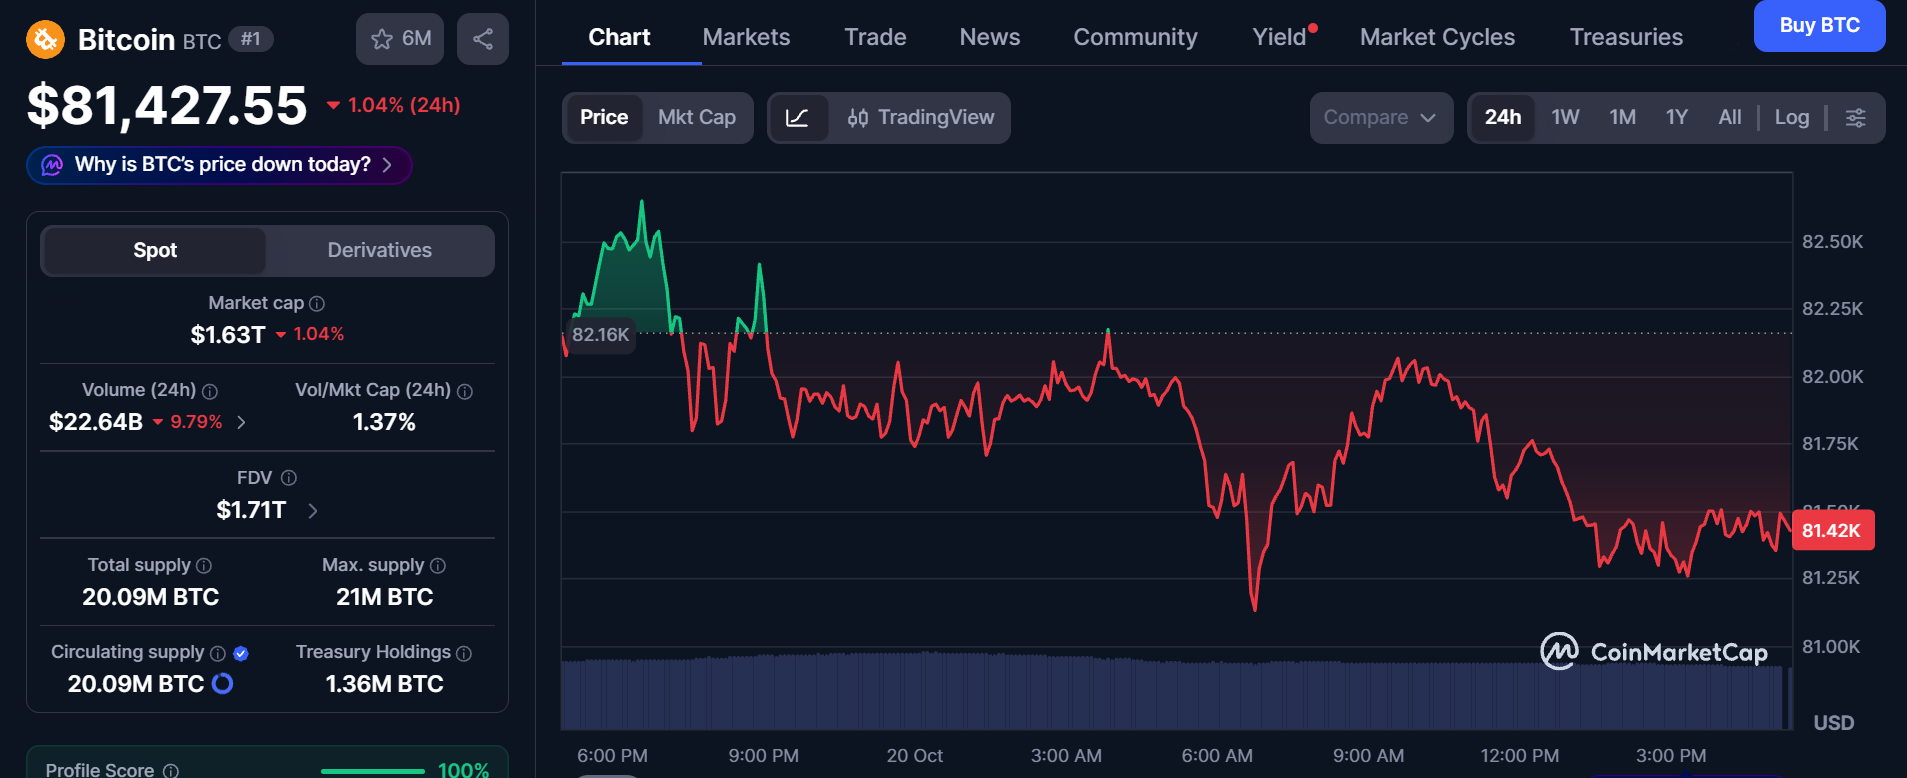
BTC is trading at about $81,463. The 24-hour trading volume is roughly $10.95 billion, and the major USD and USDT pairs on large exchanges show a dip of around 1% over the last day.
The coin is also well below its peak. The same market page notes that prices reached new highs above $125,000 in early October 2025, which puts today’s level roughly 35% lower.
| Metric | Level |
| Price (Oct 20, 2026, 6:10 am EDT) | $81,462.90 |
| 24-hour trading volume | $10.95B |
| 24-hour move (major pairs) | About -1% |
Source: CoinMarketCap Live Data
How does this connect to J.P. Morgan’s estimate? Purely as simple math, $81,463 growing at 10% a year would reach roughly $211,000 after 10 years and about $340,000 after 15 years.
This is only an illustration. The forecast is a return assumption, not a price target, and real prices will not move in a straight line, especially with 55% volatility.
Bitcoin vs Stocks, Gold and REITs: The Numbers
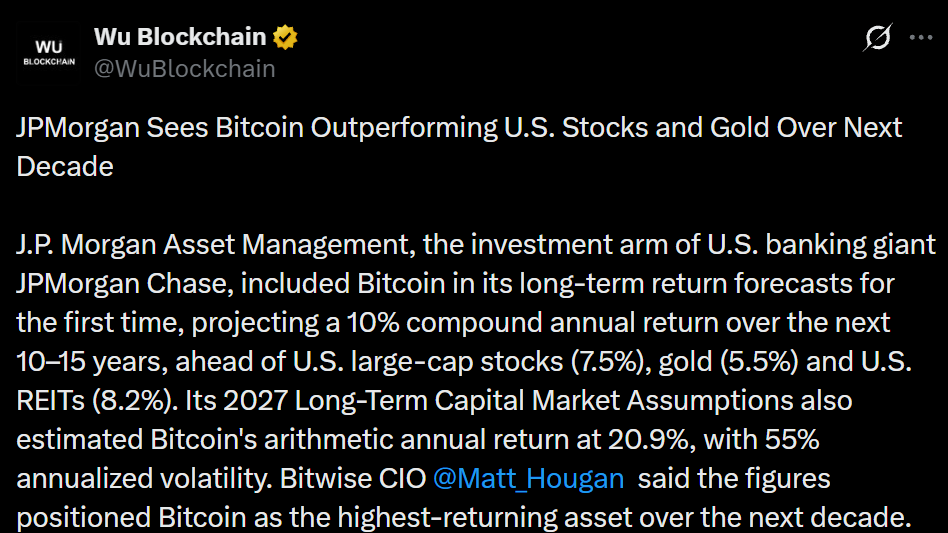
According to the full 2027 report, the JPMorgan Bitcoin Forecast is a 10% compound annual return, a 20.9% arithmetic return and 55% annualized volatility.
The comparison figures come from the official USD assumption matrix.
| Asset | Compound annual return | Annualized volatility |
| BTC | 10.0% | 55% |
| Private equity | 9.8% | 20.3% |
| U.S. REITs | 8.2% | 17.3% |
| U.S. large cap | 7.5% | 18.0% |
| Gold | 5.5% | 17.2% |
In plain words, the 10% figure sits above every asset in the USD matrix, with private equity closest at 9.8%.
The firm also expects a balanced global stock-bond portfolio to return 7.0%, while global aggregate bonds rise to 5.3%, the highest level in two decades, as per the same official page.
Why the Report Shows Both 10% and 20.9%
Many readers will see two different return numbers and wonder which one is real. The difference is simple.
-
Arithmetic return (20.9%) is a plain average of yearly gains and losses.
-
Compound return (10%) is the growth rate an investor would actually keep after the ups and downs.
Here is an easy example. If an investment jumps 100% in one year and then falls 50% the next, the simple average looks like a 25% gain. But the money ends exactly where it started.
This gap is called volatility drag, and it grows when prices swing wildly. With volatility at 55%, the gap for this asset is large.
For comparison, U.S. large-cap stocks show 8.95% arithmetic against 7.5% compound, and gold shows 6.86% against 5.5%, based on the matrix linked above.
Source: WuBlockchain on X
So the smaller the swings, the smaller the gap between the two numbers.
Why It Is Still Outside the Main Portfolio Models
The headline is bullish, but the firm adds an important limit. On its official outlook page, it says it does not yet include the cryptocurrency in its main covariance matrices.
It also says unstable correlations with other assets make a strategic allocation difficult.
That means the forecast should not be read as a recommendation to add the coin to every portfolio.
The official matrix itself states that its figures are not a promise of actual results, not a recommendation to buy or sell, and are subject to change without notice.
It also explains that the estimates are passive only and do not account for fees, taxes, trading costs or active management, so a real portfolio can look very different from the model.
What This Means for Crypto Investors
The JPMorgan Bitcoin Forecast is a useful signal about how traditional finance is starting to treat digital assets.
Still, readers should keep a few points in mind:
-
The 10% figure is a long-term planning assumption, not a price target.
-
It beats U.S. large-cap stocks by only 2.5 percentage points, yet the swings are roughly three times larger (55% against 18%).
-
Compound growth does not mean steady yearly gains. Deep drawdowns can happen along the way.
-
Forecasts can change from one edition to the next.
-
The original documents should be checked before sharing or acting on any number.
Conclusion
The JPMorgan Bitcoin Forecast marks a clear milestone: one of the world’s largest asset managers now puts a number on BTC’s long-term growth, and that number tops stocks, gold and REITs.
At the same time, the firm keeps the asset out of its main models because of unstable correlations and very high volatility.
Treat this as an important data point, not a guarantee. As the firm’s own disclaimer notes, investments can fall as well as rise, and investors may not get back the full amount invested.
Disclaimer
This article is for educational and informational purposes only and is not financial or investment advice. Crypto assets are high risk, their prices can be very volatile, and you can lose some or all of your money. Always do your own research and consider speaking with a licensed financial advisor before making investment decisions.






