Bitcoin Price Prediction: Can ETF Inflows Break the $82K Squeeze?


Bitcoin has been drifting sideways for days. Boring, right?
But the fund desks just did something that hasn't happened in two weeks. Traders who sold the dip are still asking why Bitcoin slipped lower, and that debate may flip fast.
One number changed the mood. Not the price. Not yet.
Bitcoin Price Prediction Today: Where Bitcoin Stands
At 05:00 UTC on October 20, 2026, BTC price today reads $82,013.81, down 0.77% in 24 hours, per CoinMarketCap live data. Market cap is $1.64T.
The 24-hour range ran from $81,107.23 to $83,072.47. Bitcoin still trades 34.98% below its $126,198.07 peak from October 7, 2025.
Performance Across Timeframes
Short windows are flat. Four hours shows +0.57%, seven days +0.34%, and 30 days +0.99%. The longer view is wider. Ninety days is +23.36%, the year to date is -6.25%, and one year is -24.50%.
Volume and Supply: Is Money Rotating In?
Trading volume over 24 hours is $24.49B, up 19.34%. Rising turnover on a flat price usually means buyers are soaking up sell orders. Supply sits at 20.09M of the 21M BTC cap. That fixed ceiling anchors every crypto price predictions debate.
Bitcoin ETF Inflows Snapshot
Bitcoin ETF inflows hit $526.60M on October 19, 2026 (UTC), according to SoSoValue ETF data. Cumulative net inflow reached $57.40B. Net assets stand at $105.46B, or 6.40% of Bitcoin's market cap. Value traded was $2.09B.
Issuer Split: One Fund Did the Work
BlackRock's IBIT pulled in $665.16M. Fidelity's FBTC lost $83.63M, and Grayscale's GBTC shed $54.93M. 9 other funds printed zero. Buyers showed up, but through one door. So who's really buying here?
Two Weeks of ETF Flow in Context
Five sessions from October 12 to 16, 2026, netted about -$228.57M. One Monday erased that more than twice over. But a single day isn't a trend. And whale selling earlier showed how fast sentiment flips.
Futures Activity and Open Interest
Futures volume reached $48.75B against $4.41B in spot, per CoinGlass derivatives data. Open interest, the total value of open contracts, is $52.88B. Binance handled $14.44B of that futures volume. Derivatives still run this tape.
Liquidations: Longs Took the Hit
Liquidations hit $45.17M in 24 hours. Longs lost $30.82M. Shorts lost $14.35M. Bulls took the pain. But the last hour flipped, with shorts losing $480.24K against $2.63K for longs. Still small next to the earlier liquidation wipeout.
Long/Short Ratios Show Crowded Longs
Binance BTC/USDT accounts read 1.6954 long/short, OKX shows 1.77, and Binance top traders sit at 1.7917 by accounts and 1.7964 by positions. Longs are crowded. Crowded and exposed if $81,107 breaks. That's where the bearish risk lives.
Strategy Adds More BTC
Strategy repurchased $193M of STRC, one of its digital credit securities, and acquired 267 BTC, Michael Saylor said on X. Holdings reached 848,517 BTC plus $5.3B in USD assets as of October 18, 2026. The repurchase program also grew from $2.0B to $3.0B. Small buy, loud message.
Bitcoin Technical Analysis: Descending Channel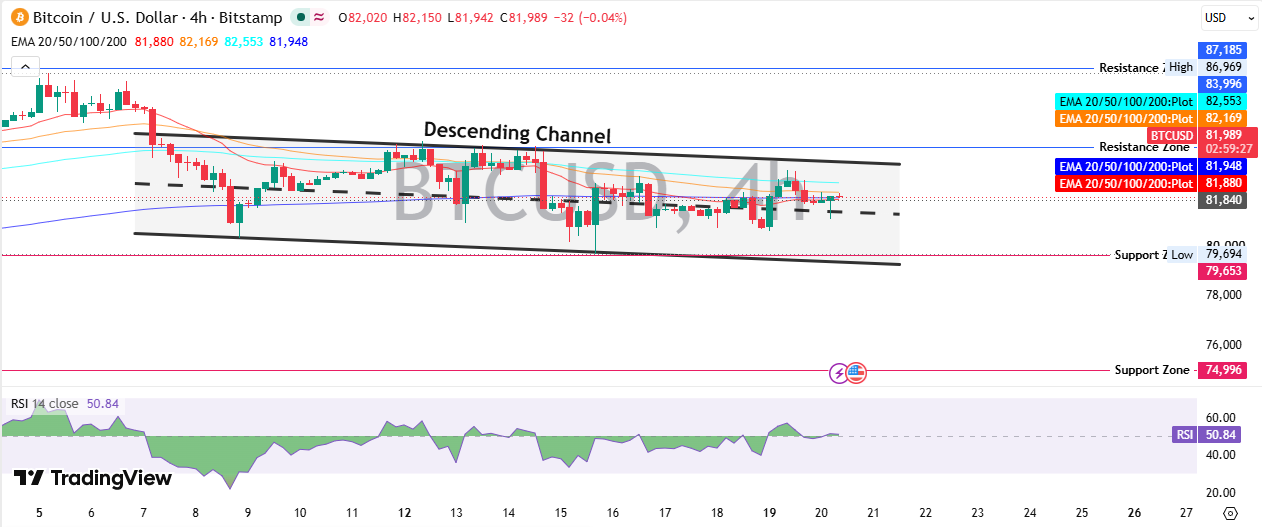
Bitcoin technical analysis on the 4H BTC/USD chart shows a descending channel, a sloping lane of lower highs and lower lows, via the TradingView 4H chart. Trading at $81,989 puts the price in the mid-channel. Neither edge is in play. This Bitcoin price prediction hinges on which boundary breaks first.
20 EMA, 50 EMA, 100 EMA and 200 EMA read $81,880, $82,169, $82,553 and $81,948. An EMA, or exponential moving average, tracks recent trading while weighting fresh action more.
That band spans just $673, and the price sits inside it. Squeezes like this end in a move, and direction is the only unknown. A previous breakout-or-breakdown setup faced the same indecision.
RSI 14 sits at 50.84. RSI, the relative strength index, scores momentum from 0 to 100, and 50 means balance. Momentum is flat. And flat RSI inside a squeeze usually waits for a trigger.
Bitcoin Support Levels
Bitcoin support and resistance work starts below. First support is $81,107, the 24-hour low, then $79,694, then $74,996 as the deeper zone. Earlier coverage of Black Monday key levels adds context.
Bitcoin Resistance Levels
The first wall is $82,553, the EMA 100. Then $83,996, followed by $86,969 to $87,185. Bulls need $83,996 before anything else counts.
Scenario Table
Scenario | Trigger | Target | Invalidation | Liquidity condition |
Bull | Trading above $83,996 with another ETF inflow day | $86,969 to $87,185 | Falls below $81,107 | Short liquidations above $83,072 feed momentum |
Base | Range between $81,107 and $82,553 | $83,072 on a bounce | Breaks either edge with volume above $24.49B | Balanced flows, thin liquidations |
Bear | Trades below $81,107 as ETF outflows return | $79,694, then $74,996 | Reclaims $82,553 | Crowded longs trigger a flush |
Bitcoin Price Prediction: What Comes Next
This Bitcoin price prediction leans cautiously bullish while $81,107 holds. ETF money is back, and Strategy keeps buying.
Bearish felt like the easy call, at least until the ETF line showed up. But momentum is flat, so $83,996 decides the next leg of any BTC price prediction. And midterm election risk around November 3, 2026 can't be ignored.
Risks That Could Flip the Setup
ETF flows have flipped between inflow and outflow almost every session since October 6, 2026. A repeat of the -$244.13M day on October 8 would hurt.
Crowded longs add fuel. Headline risk from AI-linked crypto news can move sentiment fast, and any Bitcoin price prediction carries that uncertainty.
Disclaimer: This article is for information only and is not financial, investment, or trading advice. Crypto prices are highly volatile, and losses can be total. Price targets are scenarios, not guarantees. Always do your own research and consult a licensed financial advisor before investing.