Jupiter Price Prediction November 2026: Can JUP Reclaim $0.3745?


Can Jupiter reclaim the $0.3745 level after a 26.64% drop in 30 days?
Jupiter Price Prediction November 2026 starts with one level. Jupiter trades at $0.2409 per CoinGecko data captured at 08:30 UTC, sitting on the lower line of a falling wedge. The earlier JUP channel analysis covered how that structure formed.
Jupiter 24-Hour Market Data Snapshot
CoinGecko market data captured at 08:30 UTC ranks $JUP at 80th. FDV, or fully diluted valuation, is the value if every token in total supply were in circulation.
| Metric | Value |
| Price | $0.2409 |
| 24-hour change | -4.84 |
| JUP market cap | $801.564M |
| FDV | $1.657B |
| 24h trading volume | $48.475M |
| Total value locked | $2.201B |
| Perps 24h open interest | $78.662M |
Source: CoinGecko, Nov 3, 2026, 08:30 UTC
TVL, or total value locked, counts assets deposited in the protocol.
JUP Price Performance Against the 24h Range
$JUP fell 4.84% in 24 hours and 13.04% over seven days, per the CoinGecko price performance panel captured at 08:30 UTC.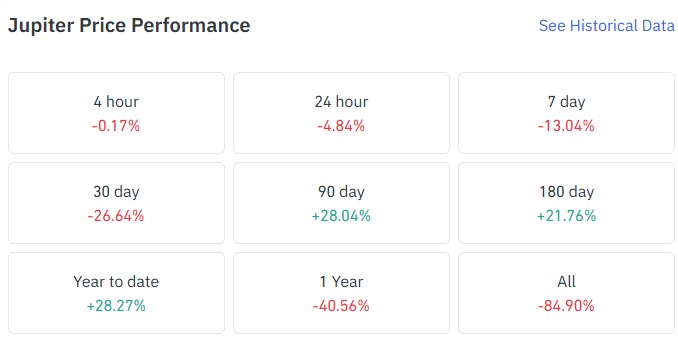
Source: CoinGlass, Nov 3, 2026, 08:30 UTC
The 24h range runs from $0.2397 to $0.2553. Just 0.71% above the 24h low.
30-day losses are steeper at 26.64%. But the 90-day change is still +28.04%, and year-to-date reads +28.27%.
JUP Whale Wallets and Holder Concentration
The top 10 holders control 65.17% of the total supply, or 4.47B tokens, per Solscan holder data captured at 08:30 UTC. A whale wallet is an address large enough to move price.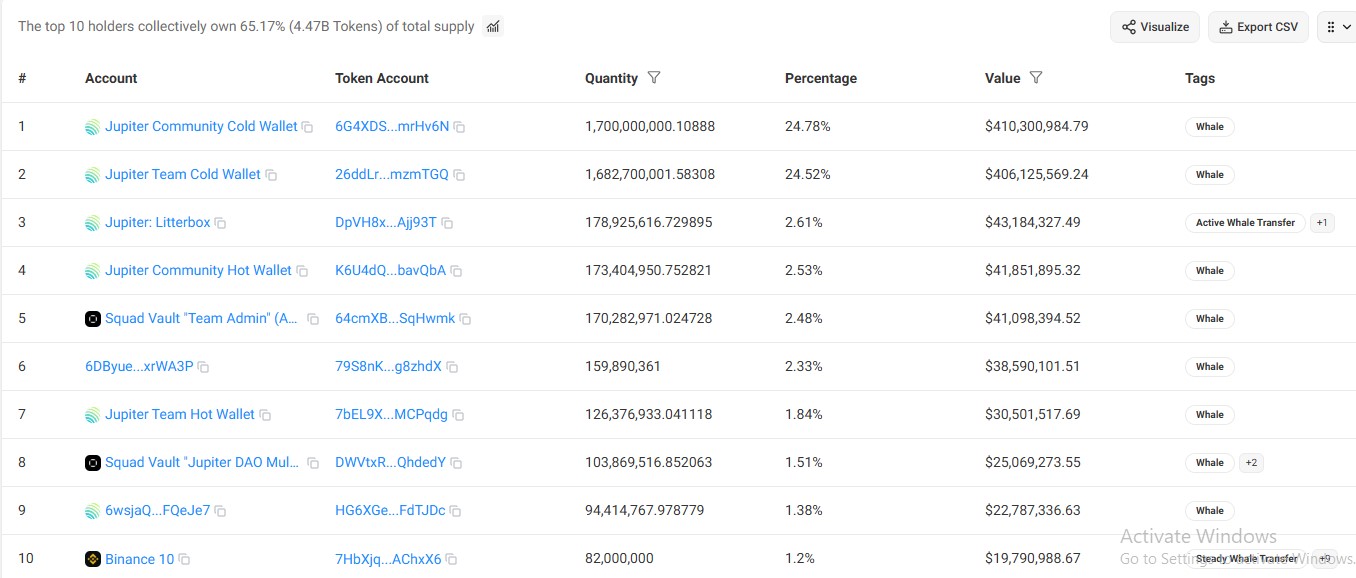
Source: Solscan, captured Nov 3, 2026, 08:30 UTC
Two Jupiter cold wallets lead the list. The Community Cold Wallet holds 24.78%, worth $410.30M. The Team Cold Wallet holds 24.52%, worth $406.13M.
Together, that's 49.30% of supply, or 75.6% of the top-10 total. That level of holder concentration means one large transfer can move supply fast.
JUP Open Interest and Futures Volume
Open interest is the value of futures contracts still open and unsettled. CoinGecko lists perps 24h open interest at $78.662M, and derivative detail sits on CoinGlass JUP data.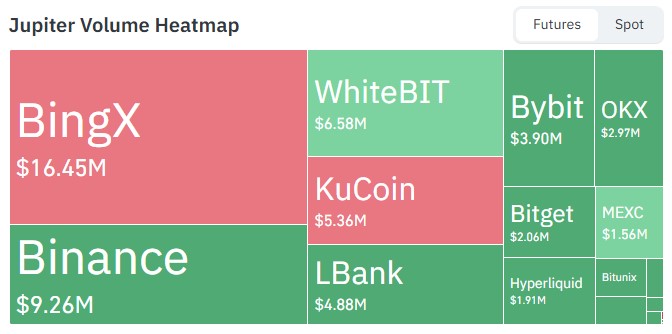
Source: CoinGlass, captured Nov 3, 2026, 08:30 UTC
On the futures volume heatmap captured at 08:30 UTC, BingX leads at $16.45M. Binance follows with $9.26M, a $7.19M gap.
Is one venue driving the move? BingX trades 1.78x Binance's volume, so the question is fair.
JUP vs SOL Price Comparison
SOL trades at $91.64 per CoinGecko SOL data captured Nov 3, 2026, 08:30 UTC.
| Metric | JUP | SOL |
| Price | $0.2409 | $91.64 |
| Market cap | $801.564M | $54.215B |
| Perps open interest | $78.662M | $7.984B |
| Open interest to market cap | 9.81% | 14.73% |
| FDV to market cap | 2.07x | 1.08x |
Source: CoinGecko, captured Nov 3, 2026, 08:30 UTC
Positioning runs heavier on SOL. And $JUP's 2.07x FDV gap means more tokens still have to reach the market.
Jupiter Technical Analysis: 1-Day Timeframe
This Jupiter Price Prediction November 2026 reads the TradingView $JUP/USDT daily chart on Binance, captured Nov 3, 2026, 08:30 UTC. Late September brought a push to the $0.3745 resistance zone, where sellers have capped prices before.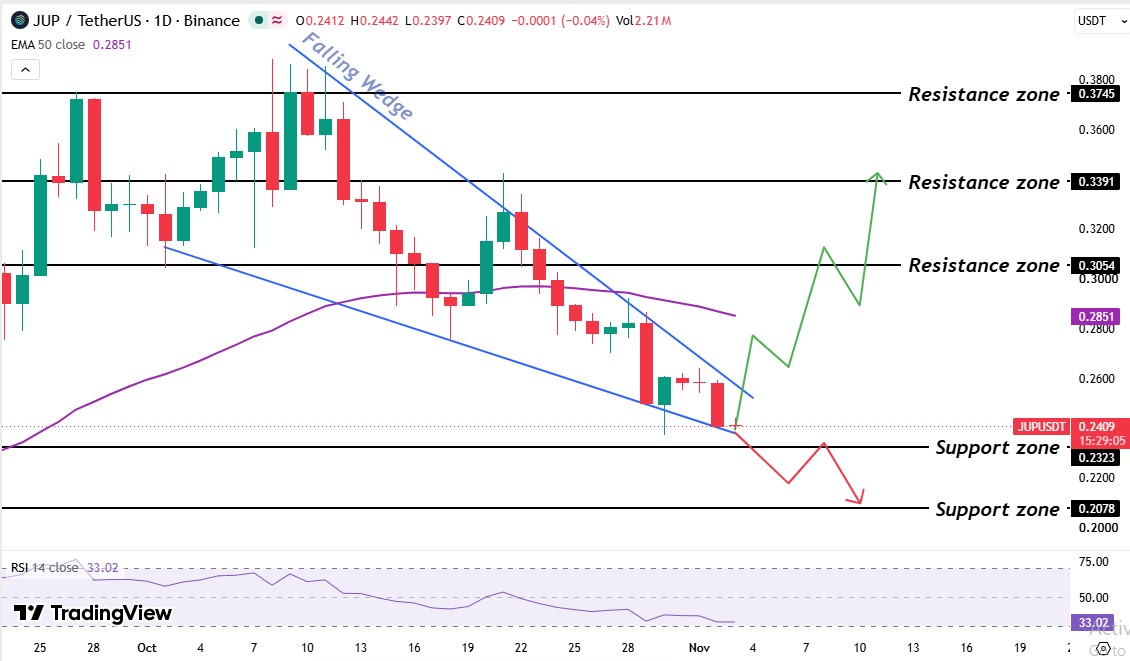
Source: TradingView, JUP/USDT daily on Binance, captured Nov 3, 2026, 08:30 UTC
Sellers won that fight. Lower highs and lower lows followed, and the falling wedge took shape. A bounce in the third week of October ran into the upper wedge line near $0.3391 and failed. A slide below the 50-day EMA came next in late October.
Price now sits on the lower wedge line. Support, a zone where buyers have stepped in before, sits at $0.2323.
The 50-day EMA sits at $0.2851. Price trades 15.33% below it, and the line has rolled over after peaking in mid-October. A late-October rebound tried that area and failed, so the EMA acts as a resistance.
The RSI, the 14-day reading, is 33.02, 3.02 points above the 30 line that marks oversold conditions. If RSI starts rising, sellers are going to lose their strength, and a wider market context sits in the latest crypto news updates.
JUP Support Levels and Resistance Levels
| Level | Type |
| $0.2078 | Support |
| $0.2323 | Support |
| $0.2851 | 50-day EMA |
| $0.3054 | Resistance |
| $0.3391 | Resistance |
| $0.3745 | Resistance |
Jupiter Price Forecast: Bull, Base, and Bear Scenarios
| Scenario | Trigger | Target | Invalidation |
| Bull | Daily candle trades above the $0.2851 EMA level | $0.3054, then $0.3391 | Daily candle trades below $0.2323 |
| Base | Price holds above $0.2323 | $0.2851 | Daily candle trades above $0.2851 or below $0.2323 |
| Bear | Daily candle trades below $0.2323 | $0.2078 | Daily candle trades above $0.2851 |
Technical invalidation is the main risk. A daily candle trading below $0.2323 voids the wedge bounce and opens $0.2078. Supply risk sits behind it, since a transfer from a cold wallet holding 24.78% could hit price fast.
Jupiter Price Prediction November 2026: Expert Outlook
As per CoinGabbar analysis, the stance here is cautious. Price trades under a falling 50-day EMA, the RSI reads 33.02, and the lower wedge line is the only support holding. A rebound can reach $0.3054 once the EMA is reclaimed, which keeps the Jupiter Price Prediction November 2026 neutral until a daily candle trades above $0.2851.
The condition to monitor is the next daily candle near $0.2323. If it trades below that level on rising volume, sellers have broken the wedge.
Disclaimer: Crypto is highly volatile, and positions can lose their full value within hours. This Jupiter Price Prediction November 2026 is an analysis, not financial advice.