Kaspa Price Prediction October 2026: Can $0.0374 Hold Before $0.0648?


Kaspa price prediction searches make sense this October. KAS broke out of a months-long channel, then slipped back to $0.04245.
This October Kaspa price forecast tracks $0.0374 for support and $0.0648 for the next real test.
Kaspa Price Prediction: What Is Happening Now?
Current Price and 24H Performance
$KAS price today is $0.04245, down 1.61% in 24 hours.
CoinMarketCap data as of October 2, 2026, 08:10 UTC, puts the 24-hour range at $0.04061 to $0.04427.
Charts disagree. MEXC's daily candle shows +2.52% since 00:00 UTC, while CoinMarketCap tracks a rolling 24 hours.
Trading Volume
Volume, the total value traded, is $21.34M, up 12% in 24 hours.
The dip looked like weakness at first, but rising volume changed that read.
Market Cap, FDV, and Supply
Market cap is $1.17B, which ranks Kaspa #60. It's price times circulating coins.
FDV, or fully diluted valuation, is $1.21B and counts every coin that could ever exist. And with volume at 1.67% of market cap, activity feels steady, not frantic.
Circulating and total supply both sit at 27.73B KAS, against a 28.7B max. Roughly 0.97B KAS remains.
Holder Concentration
Whale risk is real here. The top 10 addresses hold 25.42% of circulating supply, and the top 100 hold 40.08%.
Just 559,669 addresses hold at least 1 KAS.
Exchanges rank among the biggest labeled wallets on the Kaspa explorer address list. But they hold customer coins too, so it's not all whale money.
Why Is $KAS Moving Today?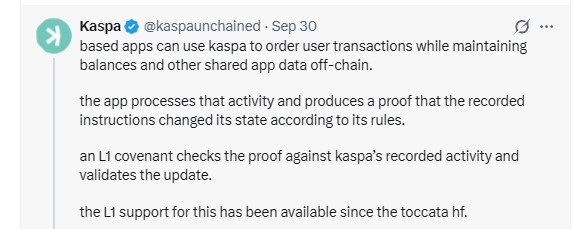
Kaspa's team posted on September 30, 2026, about based apps keeping balances off-chain, per Kaspa's official X post. L1 support has been live since the Toccata hard fork.
A newer post shows a vault that unlocks only when a price condition is met. It trusts an oracle, an outside data feed. That's a risk.
Price is dipping, not crashing. Down 1.61% after a sharp September breakout.
Bitcoin and Market Context
Bitcoin trades at $86,385.33, up 3.57% in 24 hours, with $38.47B in volume. KAS slipped 1.61% in that same window.
That's relative weakness, not market-wide panic.
Kaspa Technical Analysis
This Kaspa technical analysis maps $KAS support and resistance on the daily MEXC KASUSDT chart from TradingView.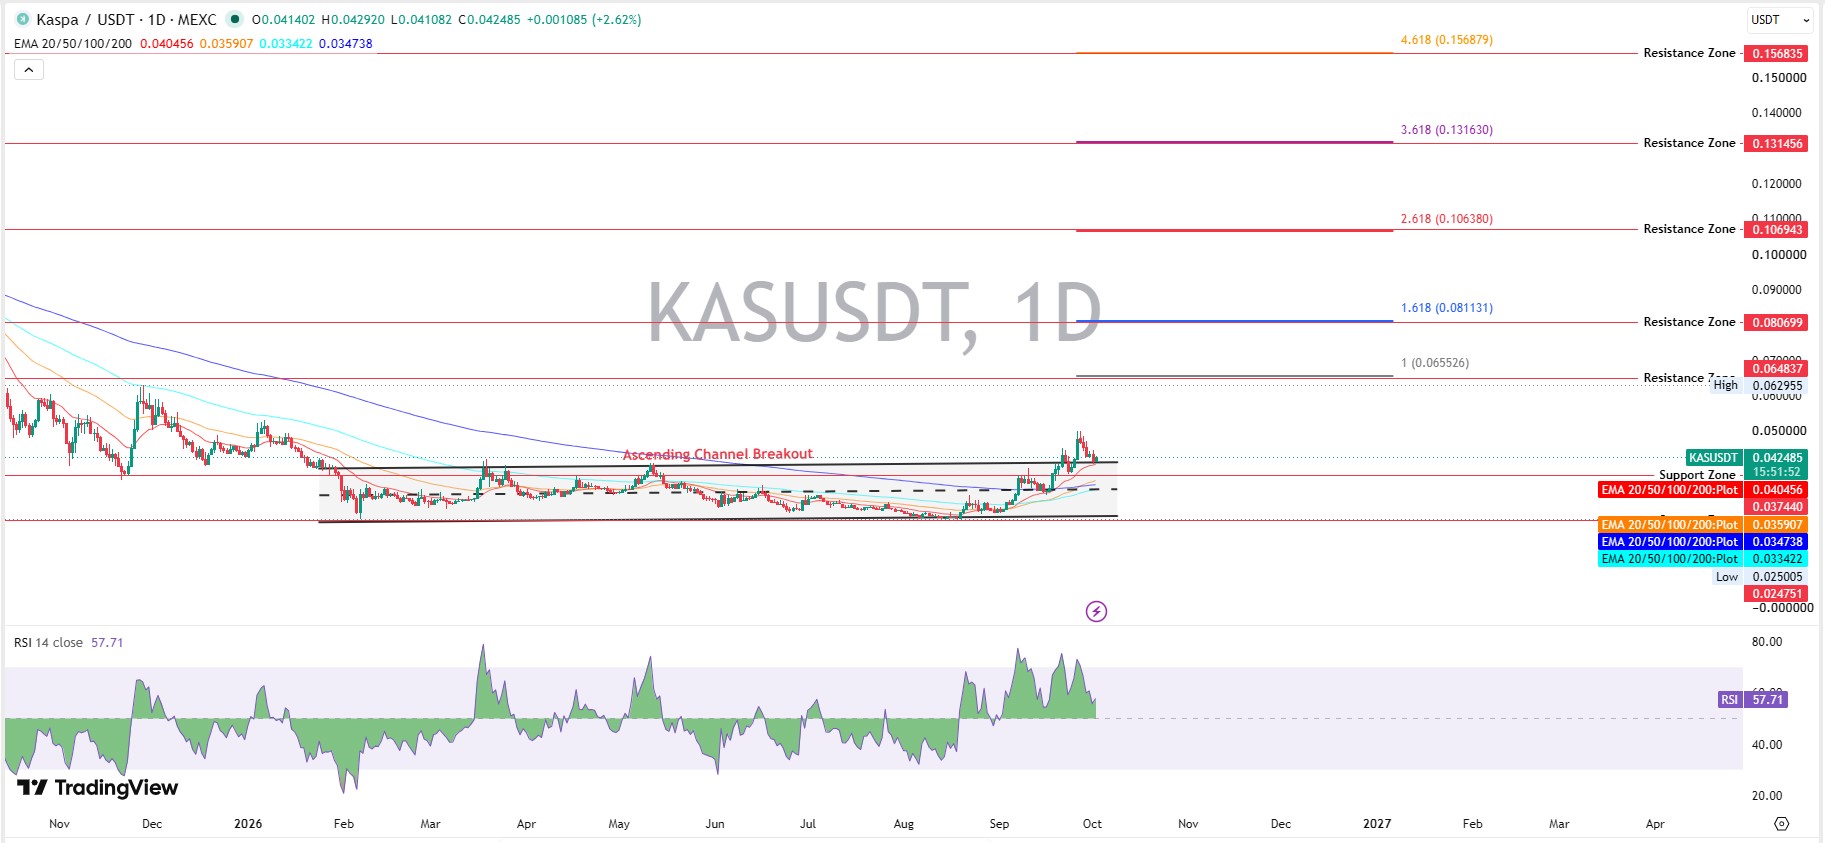
RSI, MACD, EMA and Bollinger Bands Explained
RSI, the relative strength index, scores momentum from 0 to 100. Kaspa's reading is 57.71.
That's neutral with a bullish lean, not overbought. It pushed above 70 during the September rally, then cooled.
MACD compares two moving averages to show trend momentum. Its line is 0.002894 against a signal line of 0.003126.
That's a mild bearish crossover, with the histogram at -0.000233. But both lines still sit above zero. Momentum is cooling.
EMAs, or exponential moving averages, weight recent days more. $KAS trades above all four.
The 20-day sits at $0.040456, the 50-day at $0.035907, the 100-day at $0.033422 and the 200-day at $0.034738 on the TradingView KASUSDT chart. That structure supports a bullish outlook.
Bollinger Bands show how far price stretches from its 20-day average.
Basis is $0.040047, upper band $0.048990 and lower band $0.031103. Price trades in the upper half.
Key Support Levels
Support is a zone where buyers stepped in before. The nearest chart support is $0.037440, then $0.024751.
For context on how this base formed, read the August 2026 Kaspa forecast.
Key Resistance Levels
Resistance is where sellers tend to show up. The next target is the upper Bollinger band at $0.048990, then the $0.064837 zone.
Higher zones sit at $0.080699 and $0.106943, and last month's setup lives in the September 2026 Kaspa prediction.
Can $KAS Rally Continue?
Short-Term Outlook
The short-term outlook is cautiously bullish. A retest is normal after a breakout. Especially one this clean.
But cooling MACD says patience. So is this a healthy pause or the start of a lower high?
Across seven days, a hold above $0.040 keeps buyers in charge. Compare more coin price predictions before deciding.
What Could Change the Outlook?
Developer news, exchange flows, and Bitcoin direction could shift this setup. A daily trade below $0.037440 on rising volume would flip the stance.
Scheduled catalysts live on a coin events calendar. Checking it before trading makes sense.
$KAS Price Prediction for October 2026
Bull Case
If buyers hold the channel top. Then $0.048990 is next, and a Kaspa price target of $0.064837 could follow before October ends.
Volume would need to confirm it. A trade below $0.037440 would void the idea.
Base Case
This $KAS price prediction for October 2026 leans sideways, between $0.0374 and $0.0490. That fits a neutral RSI and a cooling MACD.
Bear Case
If price trades below $0.037440, a bearish outlook could open at $0.0347 and $0.0334, where the 200-day and 100-day EMAs sit.
Deeper correction risk points to $0.0248.
Kaspa Long-Term Price Outlook
For Kaspa price prediction for 2026 year-end, $0.0648 is the first real test and $0.0807 is the stretch.
Anyone asking can $KAS reach $0.08 needs a clean break above $0.0648 first.
For Kaspa price prediction 2027, $0.1069 is possible only if developer activity grows and the market cooperates.
The long-term outlook stays open. Ecosystem growth could draw users, and some networks reward them with crypto airdrops.
Key Levels to Watch
Breakout Confirmation
A confirmed breakout needs a daily candle holding above $0.048990 with volume rising.
Fresh crypto exchange listings can lift volume, though none are verified here.
Breakdown Risk
Lose $0.037440. Then $0.024751 comes into view.
Risks That Could Change the $KAS Price Prediction
Market and News Risk
Bitcoin weakness can drag altcoins down fast.
Follow the latest crypto news before sizing a trade.
Narrative Risk
Developer updates don't guarantee demand.
Fast headlines, including AI crypto news, can add noise, so wait for volume.
Final Takeaway
The KAS price prediction stance is cautiously bullish. A breakout that holds above $0.037440 keeps the stance bullish, and a break below flips it bearish.
Anyone hunting earlier-stage plays can compare crypto presale and ICO listings, though the risk is very different.
Timing matters here.
Disclaimer: This article is for information only, not financial advice. Crypto is volatile, and no forecast is guaranteed. Data comes from CoinMarketCap, TradingView, and the $KAS explorer as of October 2, 2026, 08:10 UTC.












.webp)








