Mirex Network Price Target: Can $51K Liquidity Carry MRX Higher?


What happens when a token sits in one narrow lane for two weeks, then gets news straight from its own team?
Traders keep asking. An earlier daily price analysis covered the chart side, but the real tension sits elsewhere.
Direction isn't the loudest question behind any Mirex Network price target. A flat price can hide a lot more than most traders ever expect to see. Calm is one explanation, but a market too small to move is another, and that's harder to spot.
Some tokens trade on hope. Others trade on structure. And a few trade on whatever liquidity happens to be sitting in the pool on any given day.
Mirex Network Today: Pair Snapshot
As of 03:58 UTC on October 17, 2026, the Mirex Network pair on PancakeSwap showed $0.8126, per DexScreener pair data.
Moves were tiny: 0.10% up over 24 hours, 0.68% down over one hour, 0.79% up over six hours. Market cap and fully diluted valuation (value if every token is counted) both sat at $21.9M.
And the 4-hour chart printed $0.8077 at that same moment. Half a cent of a gap is common when single trades nudge the quote.
Trading Activity: A Dead Heat
Over 24 hours, the pair logged 298 transactions. Exactly 149 were buys and 149 were sells.
Volume reached $21K, split evenly between $10K of buying and $10K of selling. Only 16 traders took part. The earlier range breakout watch flagged this sideways phase, and volume hasn't broken it yet.
MRX Liquidity: How Deep Is the Floor?
The pool holds 31,614 MRX and 25,692 USDT, about $25K per side. That's roughly $51K of MRX liquidity in total.
Then there's the pool itself, created one month and 15 days ago. Young. And shallow. So what does a $21.9M valuation mean when only $51K sits in the pool?
Shallow pools sound like a weakness. Scratch that, they're also why a few thousand dollars can move the chart at all. Early pricing questions, like those in the launch below sale price piece, matter more when depth is this thin.
Holder Distribution: One Wallet Stands Out
DexScreener lists 1,073 holders sharing 27.0M tokens. The largest wallet holds 2.6M tokens, or 9.88%, worth about $2.1M at the current quote.
The second wallet holds 1.01%, while the PancakeSwap V2 pool address holds just 0.11%. That top wallet's paper value is roughly 41 times the entire pool.
But a holder list alone doesn't prove intent. And nothing in the supplied data shows that wallet moving. Listing talk, like the Tier 1 listing coverage, pulls in fresh buyers fast. Thin pools handle fast buyers badly.
Mirex Network KYC: Phased Plan Explained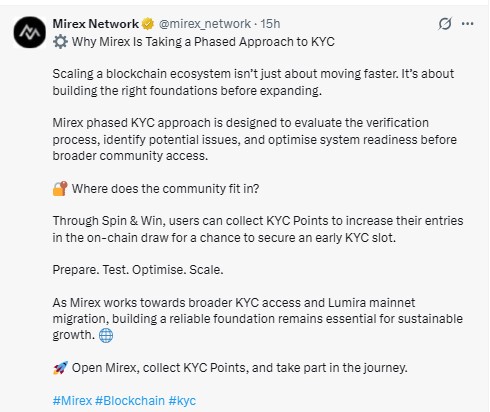
New update. Mirex Network KYC (identity verification) is rolling out in phases, not all at once.
An official Mirex X post, shared about 15 hours before the 03:58 UTC snapshot on October 17, 2026, explained why. Testing comes first. The team wants to check verification, spot issues, and confirm readiness.
Spin and Win users can collect KYC points. Those points raise entries in an on-chain draw for an early KYC slot. Wider access is still ahead. No dates given.
Lumira Mainnet Migration: Why It Matters
Lumira mainnet migration is the bigger structural event. A mainnet is a project's own blockchain, and migrations typically involve token swaps.
Nothing in the post confirms timing or terms. That gap keeps any MRX price target speculative. Background on related Lumira activity sits in earlier Lumira move coverage.
Mirex Network Price Target: Technical Analysis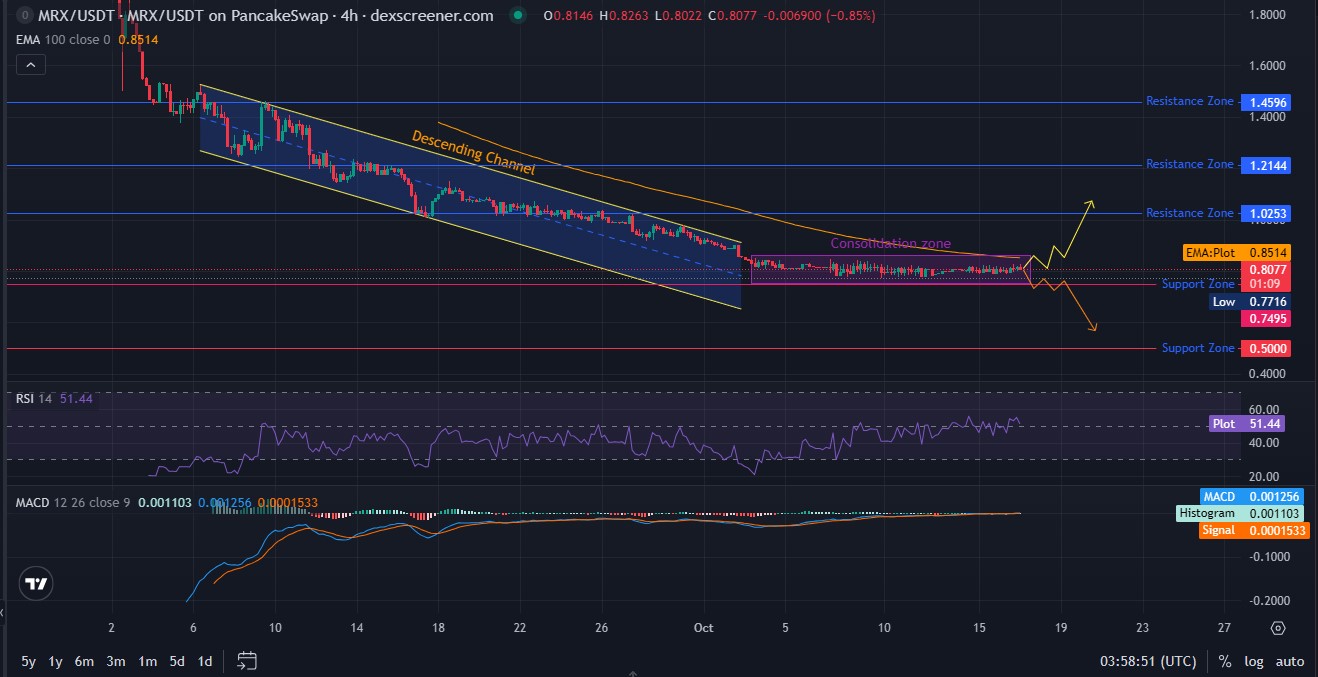
On the 4-hour chart, a descending channel ran through most of September 2026 and gave way to a consolidation zone in early October 2026.
Consolidation means a sideways box where buyers and sellers stall. Price has stayed inside roughly $0.7716 to $0.8514 for about two weeks. EMA 100 sits at $0.8514, above the latest $0.8077.
But the price still trades below it. That keeps the bias cautious, leaning bearish until the EMA flips.
RSI and MACD: Momentum Reads Neutral
RSI reads 51.44. That's neither overbought above 70 nor oversold below 30.
MACD sits at 0.001256 against a signal line of 0.0001533, with the histogram at 0.001103. A faint tilt upward, but only barely. And a faint tilt on a flat chart isn't a trend. It's a pulse.
MRX Support and Resistance Levels
Support is where buyers have stepped in before. Resistance is where sellers tend to appear. Nearby support sits at $0.7716, then $0.7495, with a deeper zone at $0.5000. Resistance begins at $0.8514, then $1.0253, $1.2144, and $1.4596.
Mirex Network Price Target Scenarios
Bull Case
If the price reclaims $0.8514 and holds with rising volume, a test of $1.0253 could follow, and $1.2144 on a stronger run. Falling back under $0.8514 would invalidate it.
Far bigger targets, like the $5 target discussion, would need much deeper liquidity.
Base Case
Sideways trading between $0.7495 and $0.8514 may continue over the coming weeks. That's the most likely path while dates stay unannounced.
Bear Case
A trade below $0.7495 could open a slide toward $0.5000. Thin depth may speed it up, and a reclaim of $0.8514 would cancel the idea.
Risks That Could Change the MRX Price Target
Liquidity is risk number one, since $51K of depth means one large order can overpower the pool.
Concentration comes next, with one wallet at 9.88%. Undated KYC and migration plans add uncertainty. Updates on the official Mirex website remain the best check.
Final Takeaway
Stance: cautious. Price sits under the EMA, momentum is neutral, and the pool is shallow.
A credible MRX price target above $1.0253 would first need a reclaim of $0.8514 and deeper liquidity. Timing matters, and dates for migration news can be tracked on a coin events calendar.
Disclaimer: This article is for informational purposes only and isn't financial advice. Crypto assets are volatile, and low-liquidity tokens carry added risk. Always do independent research before making any decision.
















