Mirex Network Price Prediction: Can a Tier 1 Listing Lift MRX?


Four million users. That's the reported figure. So why did only $17K change hands in 24 hours?
That gap, plus Tier 1 listing chatter, anchors this Mirex Network price prediction, which uses the latest data from October 12, 2026, 03:56 UTC.
MRX price today reads $0.8081, and an earlier MRX price analysis already showed a market this thin.
MRX Data Snapshot
Metric | Value |
Pair | MRX/USDT, PancakeSwap V2, BSC |
Price | $0.8081 |
24H change | -0.44% |
24H volume | $17K |
Liquidity | $51K |
FDV and market cap | $21.8M |
Trades | 270 (126 buys, 144 sells) |
Holders | 1,058 |
Figures come from live PancakeSwap pair data as of October 12, 2026, 03:56 UTC. FDV, or fully diluted valuation, is the value if every token already circulated.
Current Price and 24H Performance
MRX sits at $0.8081, down 0.44% on the day, while 6 hours show a 1.32% gain.
And the sale price gap stays wide, with the spot about 58% below the $1.92 token sale price on the project site.
Trading Volume and Market Cap
MRX volume reads 17K across 270 trades. Buy volume (8.8K) and sell volume ($8.7K) nearly match. Just 19 traders. Fifteen buyers, fifteen sellers.
MRX Liquidity Pool
MRX liquidity means the cash in the pool that buyers and sellers trade against. It holds $51K, split between 31,646 MRX and 25,573 USDT. That's about 0.23% of the $21.8M valuation, common for presale and IDO listings about 40 days old.
Holder Concentration
One wallet holds 9.88% of supply. Roughly 2.6M tokens. Worth $2.1M.
MRX holders total 1,058, and the other 1,048 wallets share 88.86%. So who absorbs the hit if that top wallet ever sells?
Contract Security Flags
Dexscreener shows four flags from GoPlus. Two more from Quick Intel. Flags don't prove wrongdoing, and the screenshot doesn't list the items. But six warnings deserve a manual read.
Tier 1 Listing and Exchange Listing Status
No Tier 1 listing notice appears in the data reviewed. Nothing names an exchange date or trading pair either.
MRX trades only on PancakeSwap V2. A real Tier 1 launch would name the exchange, the date, and the pair, and the Tier 1 listing watch tracks that story. Until then, exchange listing talk stays talk.
Why Is MRX Moving Today?
Barely. Price slipped 0.44% in 24 hours, and no exchange notice landed. One fresh item did appear. Mirex posted on X roughly 23 hours before capture, per the official X post. Stated: 4,000,000+ users across 170+ countries. Self-reported. And the chart shrugged.
Mirex Network Users: Reported vs Chain Data
App users and token holders aren't the same crowd. Still, 1,058 holders against a stated figure of 4,000,000+ Mirex Network users is a gap worth tracking.
Lumira, the second token, adds buzz, not depth, per the Lumira ecosystem move coverage.
MRX Technical Analysis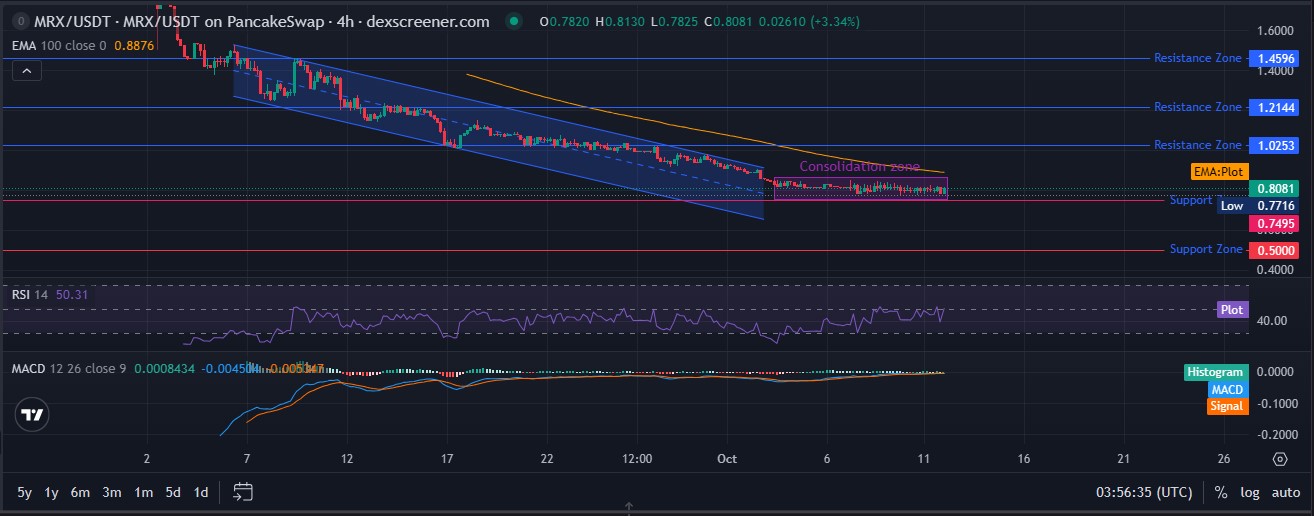
MRX technical analysis reads chart patterns and indicators to estimate where buyers and sellers may step in.
On the 4-hour chart, price slid inside a descending channel, meaning lower highs and lower lows. Then came a consolidation zone, a tight sideways range, held since early October.
RSI and MACD
RSI reads 50.31, perfectly neutral. MACD compares two moving averages to gauge direction. Its line reads -0.004504 against a signal of -0.005347, with a histogram of 0.0008434. Bearish at first glance. Then again, a neutral RSI and a positive histogram make stalemate the better word. But both lines sit below zero, so any bounce isn't a reversal. More setups live on the price prediction hub.
EMA 100 sits at $0.8876, 9.84% above the spot, and slopes down. Until trading retakes it, sellers keep the louder voice.
Support Levels
Support is a price level where buyers have stepped in before. The first sits at $0.7716, 4.52% below spot, then $0.7495. Wider support sits at $0.5000, about 38% lower.
Resistance Levels
Resistance is a level where sellers have pushed back before. The EMA at $0.8876 comes first, then zones at $1.0253, $1.2144, and $1.4596. And $1.0253 is the next target after the EMA, a 26.88% climb. Chatter like the $5 target debate sits far beyond all three, and no verified price target exists.
Mirex Network Price Prediction for October 2026
Scenarios are conditional, not promises. Data stamp: October 12, 2026, 03:56 UTC.
Bull Case
MRX could rally toward $0.8876, then $1.0253, if a breakout above the range arrives with volume well beyond $17K. A verified exchange listing would help, per exchange listing updates. Invalidation: a slide under $0.7716.
Base Case
A range between $0.7716 and $0.8130 may persist through October if volume stays near $17K. Invalidation: a decisive break either way.
Bear Case
MRX could slide to $0.7495, then $0.5000, if sellers keep control below $0.7716. Key risk: the 9.88% wallet. Invalidation: buy volume overtaking sells.
Long-Term View
Long-term targets need proof first: on-chain users, deeper liquidity, and a verified Tier 1 launch.
Key Levels to Watch
Breakout Confirmation
Sustained trading above $0.8876, with volume beyond $17K, would confirm a breakout. Dates sit on the coin events calendar.
Breakdown Risk
Trading under $0.7716 breaks the range. And $0.7495 becomes the next test.
Risks That Could Change the Mirex Network Price Prediction
Thin pool, one giant wallet, six scanner flags, and a user count without chain proof. Contract details deserve a check on the official Mirex website before a wallet connects.
Final Takeaway
Neutral momentum, weak trend, thin market. The lean stays bearish below $0.8876. This Mirex Network price prediction shifts only when volume and verified news, such as a KYC rollout update, arrive together.
Disclaimer: This article is for information only, not financial advice. Small-cap DEX tokens carry high liquidity risk, including total loss. Scenarios aren't guarantees. Data reflects October 12, 2026, 03:56 UTC. Readers should research independently.

















