Mirex Network Token Utility: Can MRX Demand Grow Without Hype?


What gives a token a job once the hype cools down?
That's the question hanging over MRX right now. Most talk around the coin has centered on mining delays and exchange hopes, not on what the token does day to day. Mirex Network Token Utility is the missing piece in any honest MRX price prediction.
Mirex Network Data Snapshot
Every number below was captured on November 2, 2026, 04:14 UTC from live PancakeSwap pair data.
Metric | Value |
Pair | MRX/USDT, PancakeSwap V2, BNB Chain |
Price | $1.0794 |
24H change | +1.41% |
24H volume | $19K |
Liquidity | $55K |
Market cap and FDV | $29.1M |
Transactions | 300 (148 buys, 152 sells) |
Traders | 13 |
Holders | 1,067 |
Largest wallet | 9.88% (2.6M MRX) |
Sells won on count, 152 to 148. But buy volume edged ahead at $9.9K against $9.7K. A stalemate, really.
Mirex Network Token Utility: What Does MRX Actually Do?
According to the official Mirex website, MRX is the native token of the MRX-20 blockchain. It pays gas fees (the small charge for processing a transaction), runs smart contracts (self-executing code), and covers other ecosystem functions.
In theory, that creates steady buying that doesn't depend on hype. Mirex Network Token Utility only counts once somebody actually uses it.
But the site publishes no transaction counts, active wallets, or fees paid. And its tokenomics table still lists zero MRX circulating, while 1,067 wallets hold the token on BNB Chain. The site also warns that features stay under legal review and can change.
$MRX Price Prediction: Can Utility Lift It Past the Sale Price?
Spot sits about 44% under the $1.92 token sale price listed on the official site. That sale price gap makes a good headline and a bad floor.
Support comes from buyers. And buyers need a reason, which utility demand would supply. Today that demand isn't measurable.
So the stance stays bearish while price trades under $1.0904, and utility can wait its turn.
Mirex Technical Analysis: The Channel Breaks, Then Stalls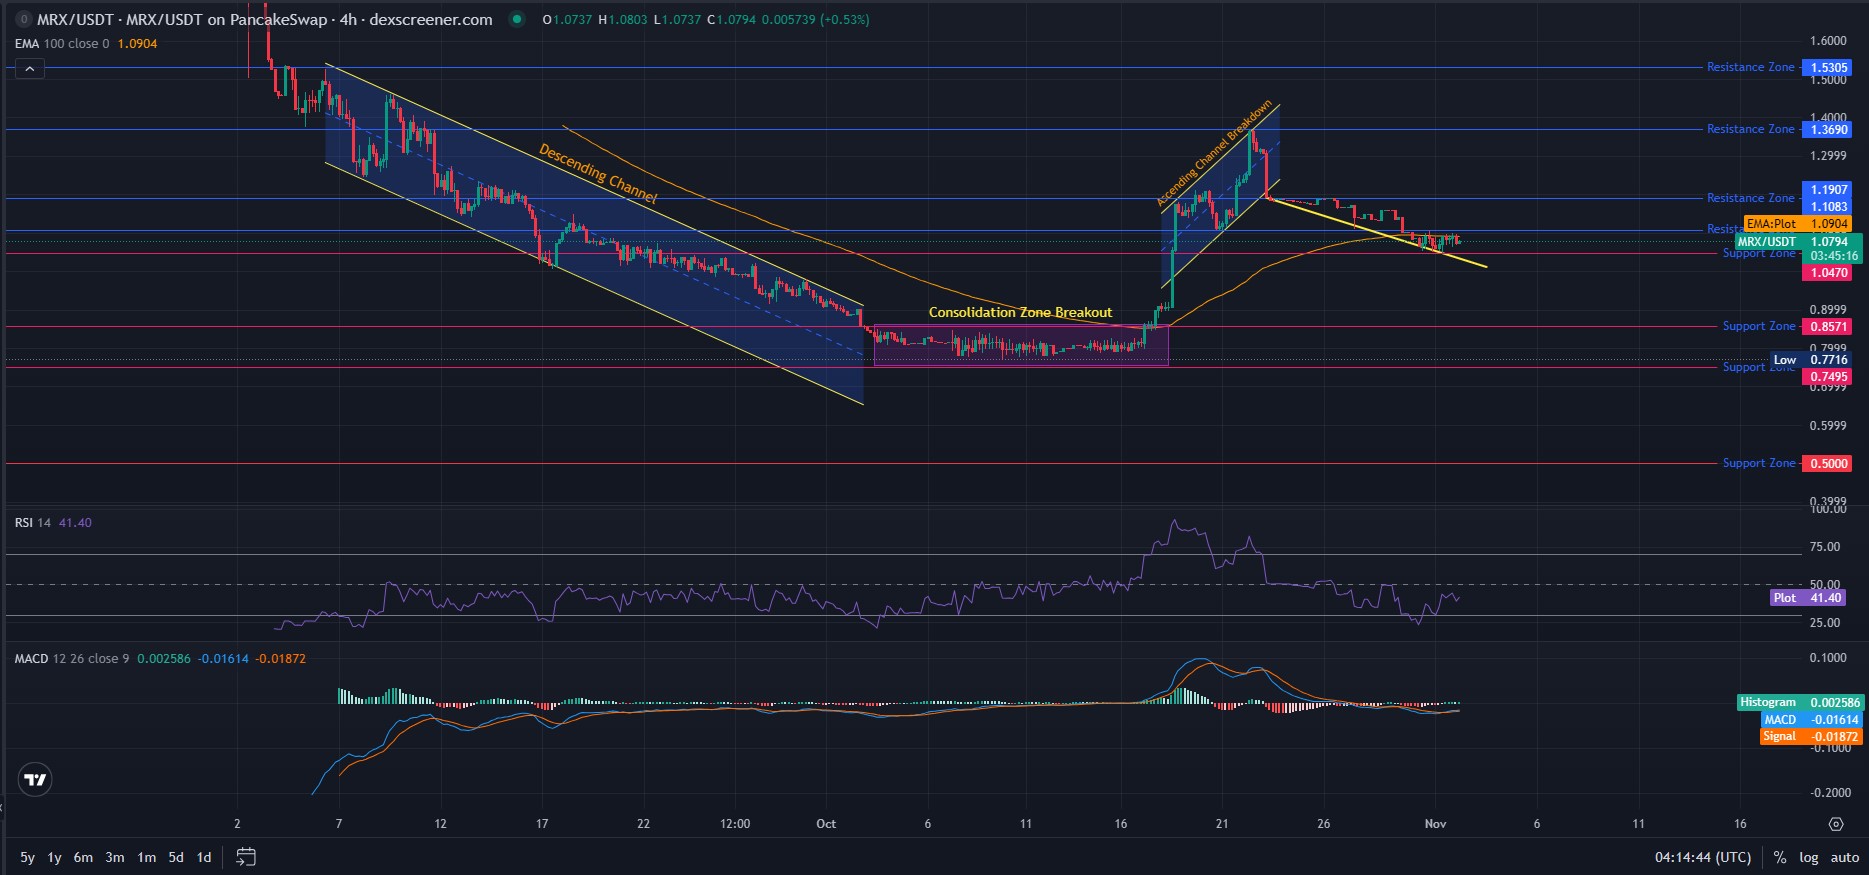
Sellers took over fast. The price topped near $1.3690 inside an ascending channel, then fell out of the bottom. The slide hit the 100 EMA, an average of the last 100 four-hour candles, now at $1.0904.
Spot trades at $1.0794, 1.0% under it. A descending trendline presses from above, and $1.0470 support sits right under the spot.
RSI reads 41.40. Weak, yet far from oversold, which starts under 30.
MACD, which compares two moving averages, reads -0.01614 against a signal line at -0.01872. That reads bearish. On second thought, the MACD line is above its signal, and the histogram turned positive at 0.002586, so sellers aren't fully in control. But both lines sit below zero.
The latest 4-hour candle spans just $1.0737 to $1.0803. Sellers paused, which isn't the same as buyers arriving.
Price can bounce from here. If buyers show up with volume.
$MRX Support and Resistance Levels
Support starts at $1.0470, then $0.8571 and $0.7495, the old base covered in the earlier range breakout watch. Below that sits $0.5000.
Resistance starts at the $1.0904 EMA, then $1.1083, $1.1907, $1.3690, and $1.5305.
Can Mirex Network Token Utility Overcome a $55K Pool?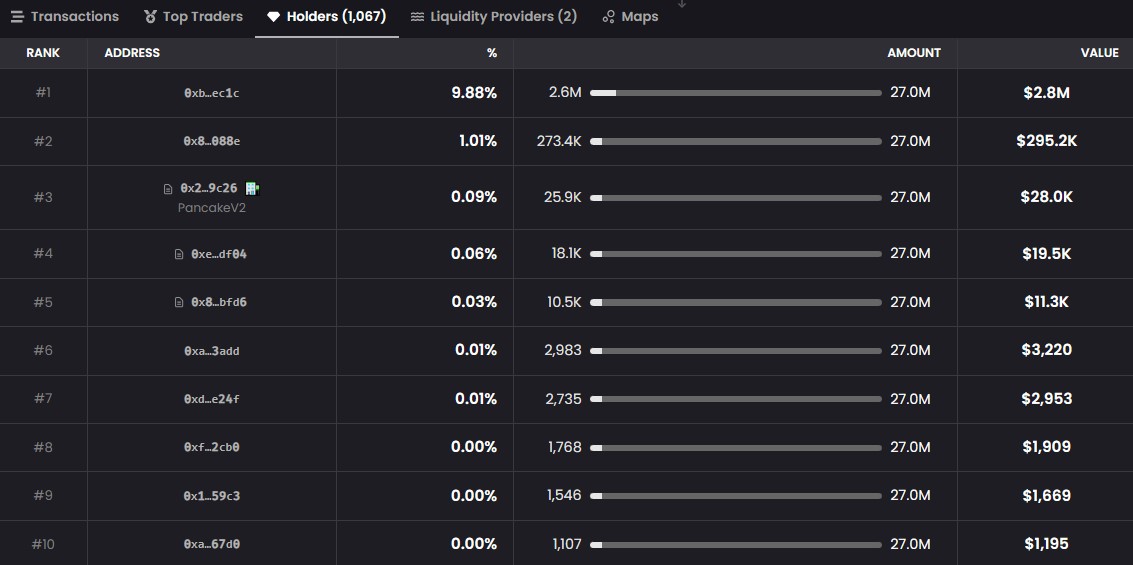
Liquidity is how easily a token trades without moving price. Here it's $55K, built from 25,923 MRX and 27,983 USDT across two liquidity providers, a weakness the pool depth risk analysis already flagged.
The largest wallet holds 9.88%, worth $2.8M. Against only $27K of MRX in the pool. A single sale of even a fraction of that stack would swamp the book. Buyers and sellers split evenly at 10 each, so neither side dominates, yet every trade moves a pool this small.
And with 13 traders in 24 hours, who exactly is paying network fees on $MRX today?
Volume reads $19K. Against a $29.1M market cap, that's 0.07%.
MRX Price Prediction Scenarios and Key Triggers
Levels come straight from the chart. No listing news sits inside them, and a verified one, tracked in the Tier 1 listing watch, would reset the liquidity column fast.
Scenario | Trigger | Target | Invalidation | Liquidity Condition |
Bull | Trading above $1.0904, then $1.1083 | $1.1907, then $1.3690 | Trading under $1.0470 | Volume above $19K, pool deeper than $55K |
Base | Trading between $1.0470 and $1.0904 | Sideways to $1.1083 | Break of either edge | Volume near $19K, buys and sells balanced |
Bear | Trading under $1.0470 | $0.8571, then $0.7495 | Trading back above $1.0904 | $27K USDT side absorbs sells poorly |
Bear math is simple. A slide from $1.0794 to $0.8571 is a 20.6% drop, and $27K of USDT has little to stop it.
But bulls need volume more than anything. Without it, a push through $1.1083 is a thin-book spike.
Long-Term $MRX Outlook: What Would Prove Utility Demand?
Bigger targets need proof first. Fees paid on MRX-20, active wallets, a published whitepaper, and a pool deeper than $55K would all count. Until then, $1.5305 stays a chart line. It sits 41.8% above spot; a rally of thin liquidity can't fund without fresh buyers.
Anyone weighing the MRX investment case should start with that proof.
Final Takeaway
Bearish below $1.0904, with $1.0470 as the floor sellers want to break. Buyers need $1.1083 and real volume to flip it.
Mirex Network Token Utility is a future catalyst, not a present one. Similar small-cap setups sit on the price prediction hub.
Disclaimer: This article is for information only and isn't financial, investment, or trading advice. Crypto, especially small-cap tokens on decentralized exchanges, carries high risk, including total loss. Scenarios aren't forecasts or guarantees. Data was captured on November 2, 2026, at 04:14 UTC, and changes fast. Readers should do their own research first.