Official Trump Price Prediction November 2026: Can it Reclaim $2.633?


Can TRUMP hold $1.649 after a 7.63% daily jump, or is this bounce about to fail?
This Official Trump price prediction November 2026 reads the daily chart, whale wallets, and derivatives data as of November 2, 2026, 04:10 UTC. New readers can start with this Trump coin review for background.
TRUMP 24-Hour Market Snapshot
Metric | Value |
Price | $1.71 |
24-Hour Change | 7.63% |
24-hour range | $1.59 to $1.77 |
Market cap | $480.883M |
Fully diluted valuation | $1.706B |
24-hour trading volume | $240.49M |
Perpetual futures 24-hour open interest | $267.779M |
Circulating supply | 281.868M TRUMP |
Source: CoinGecko, captured 04:10 UTC on November 2, 2026.
Fully diluted valuation, the value if every token traded at today's price, stands at $1.706B against a $480.883M market cap.
TRUMP Price Action Against the 24-Hour Range
Price sits 3.4% under the 24-hour high of $1.77. It's also 7.63% above the low of $1.59.
CoinGlass data shows 0.71% over four hours and 7.63% over 24 hours. Seven days adds 3.46%.
The 24-hour gain equals roughly $0.12 per token, from near the $1.59 floor.
Short-term readings are green, because the 30-day reading sits at -19.29% and the 180-day reading at -28.17%.
TRUMP Whale Wallets and Holder Concentration
Solscan holder data as of November 2, 2026, shows the ten largest wallets holding 88.72% of supply.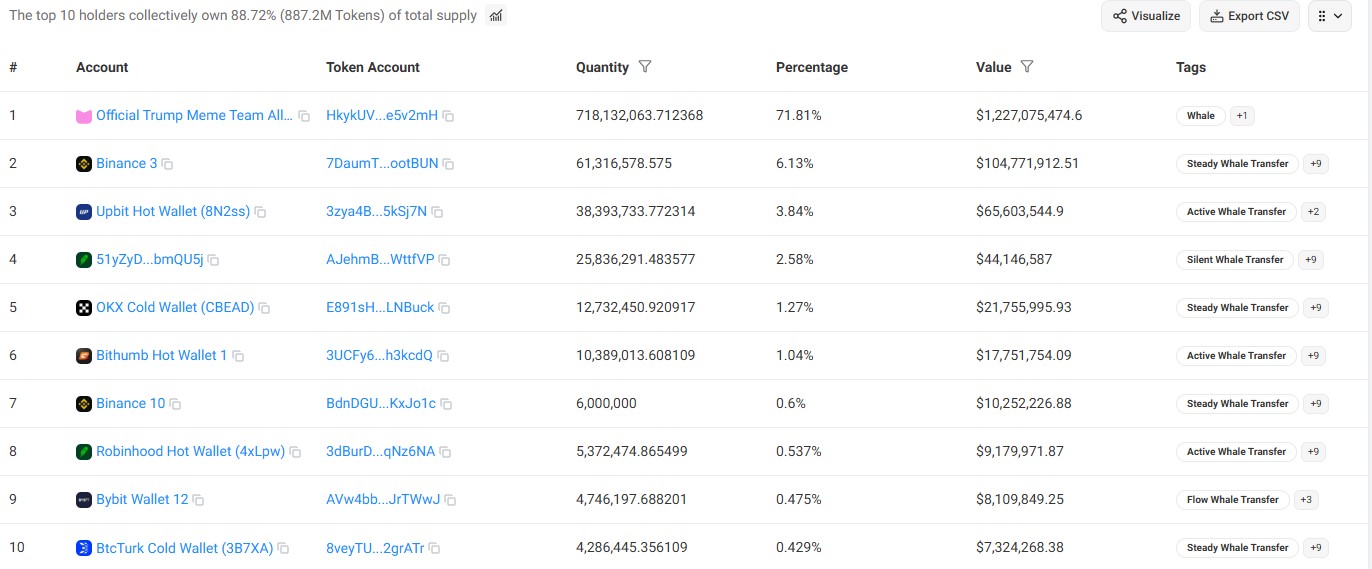
Source: Solscan, captured 04:10 UTC on November 2, 2026.
A wallet labeled Official Trump Meme Team, the largest of the whale wallets, holds 71.81%, worth about $1.227B.
So who sets the next move when one wallet holds 71.81% of supply?
TRUMP Liquidation Data Shows Two-Sided Pain
Margin traders took a beating. CoinGlass liquidation data as of November 2, 2026, 04:10 UTC shows $1.48M wiped out over 24 hours.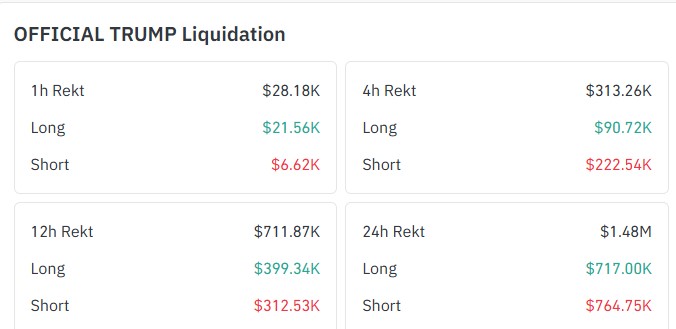
Source: CoinGlass, captured 04:10 UTC on November 2, 2026.
Longs lost $717.00K and shorts lost $764.75K, a near-even split.
Over four hours, shorts lost $222.54K against $90.72K for longs. Bears got hit first.
Then the tide flipped, with longs losing $21.56K against $6.62K for shorts in the last hour.
A liquidation is a forced exit when a borrowed-money position runs out of margin.
TRUMP Open Interest and Futures Volume
Open interest is the total value of futures contracts still active in the market.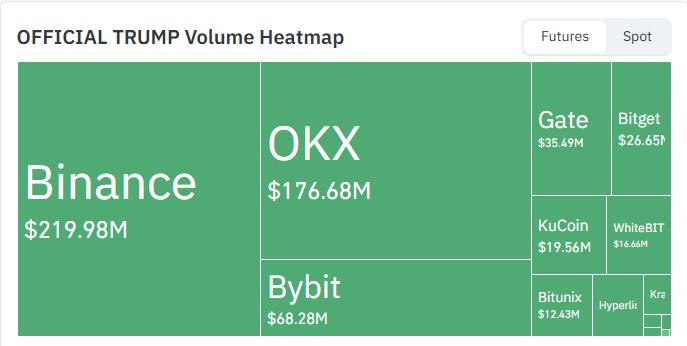
Source: CoinGlass, captured 04:10 UTC on November 2, 2026.
Perpetual futures, contracts with no expiry date, carry $267.779M in open interest per CoinGecko data as of November 2, 2026, 04:10 UTC.
CoinGlass futures volume at 04:10 on November 2, 2026 ranks Binance first at $219.98M, ahead of OKX at $176.68M.
The $43.30M gap puts Binance about 24.5% ahead of OKX. And the two venues together handle $396.66M, so latest crypto news can move both fast.
Solana Price Context for the TRUMP Coin Forecast
TRUMP is a Solana token, so the parent network matters. CoinGecko Solana data as of November 2, 2026, 04:10 UTC shows the Solana price at $95.49, down 5.6% over seven days.
But TRUMP gained 4.0% over the same seven days, outperforming its base chain.
TRUMP Technical Analysis: RSI and 50-Day EMA
This Official Trump price prediction November 2026 uses the daily chart of TRUMP/USDT, with indicators as of 04:10 UTC on November 2, 2026.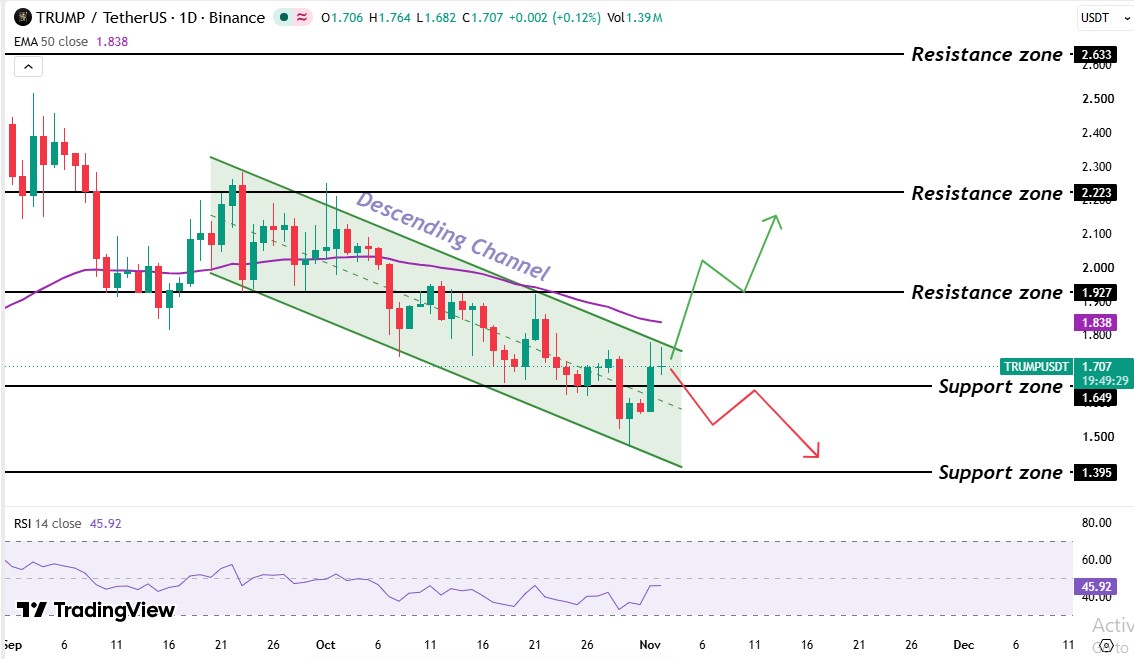
Source: TradingView, TRUMP/USDT 1D, captured at 04:10 on November 2, 2026.
Price slid from early-September highs into a descending channel, a pair of falling parallel lines marking lower highs and lower lows.
Price tried to break out of the $2.223 level but failed in late September and near $1.927 later in October. A previous falling wedge setup on TRUMP gives earlier chart context.
Right now the price is trying to break the upper line of the descending channel.
The 50-day EMA sits at the $1.838 level and price trades below it, so rallies toward $1.838 face selling pressure.
RSI reads 45.92, under the neutral 50 line. But momentum is recovering, and buyers haven't taken control yet.
TRUMP Support Levels and Resistance Levels
Level | Type |
$2.633 | Resistance |
$2.223 | Resistance |
$1.927 | Resistance |
$1.838 | 50-day EMA |
$1.649 | Support |
$1.395 | Support |
Nearest resistance is $1.838, and the nearest support is $1.649.
TRUMP Bull, Base, and Bear Scenarios
Scenario | Trigger | Target | Invalidation |
Bull | Daily candle trades above $1.927 | $2.223, then $2.633 | Daily candle trades under $1.838 |
Base | Daily candles trade between $1.649 and $1.927 | Range of $1.649 to $1.927 | Daily candle trades beyond either level |
Bear | Daily candle trades under $1.649 | $1.395 | Daily candle trades above $1.927 |
The bull case needs a daily candle trading above the channel top at $1.927.
Bears only need $1.649 to fail, which keeps this Official Trump price prediction November 2026 bearish.
Regulatory delay is one risk, since news can hit a token with one dominant wallet. Technical invalidation is the other, since daily trading above $1.927 voids the bearish case.
Official Trump price prediction November 2026: Expert Outlook
As per CoinGabbar analysis, the official Trump price prediction November 2026 leans bearish. TRUMP is down 64.45% year to date and sits inside a falling channel under the 50-day EMA.
The TRUMP price forecast stays bearish while the daily candle trades below $1.927, with $1.649 as the first test.
A daily candle trading above the 50-day EMA at $1.838, with RSI back over 50, would be the first sign sellers are losing the channel.
Disclaimer: This article is for information only and isn't financial advice. Traders should do their own research and risk only what they can afford to lose.