Is $0.24 Next? Momentum Price Prediction After a 78% MMT Pump

Can Momentum (MMT) hold a 78% daily jump, or does a pullback come first?
Traders tracking the Momentum price prediction have a simple starting point. MMT trades at $0.2149 on Binance at 06:05 UTC, after a $0.2279 high inside the same 4H candle.
A move this fast isn't rare in small caps. The Movement breakout levels give a comparison point.
Momentum Price Prediction Snapshot From CoinMarketCap
CoinMarketCap's MMT page lists the token at $0.2049, up 78.14% in 24 hours, ranked 397th. Market cap is $41.82M.
Volume hit $182.22M, up 937.3%. That's 460.98% of market cap, meaning the circulating supply traded 4.6 times in a day.
And 204.09M of 1B tokens circulate. FDV, the price times total supply, sits at $204.67M, nearly 5 times market cap.
About 796M tokens still sit outside circulation. That's the weight on any rally.
A Single Wallet Holds Almost All BNB Chain Supply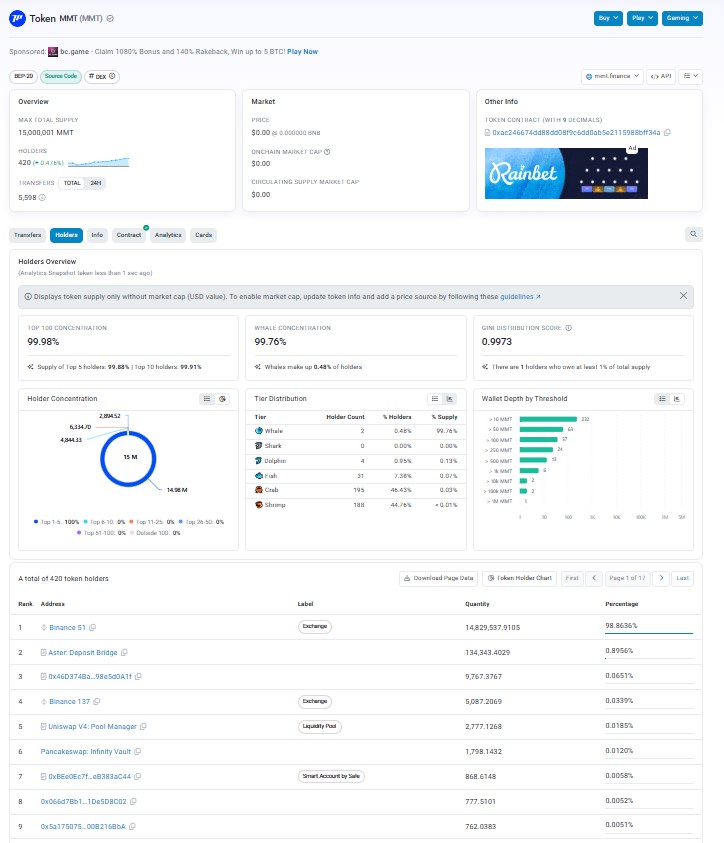
BscScan's holder data counts 420 holders for the BNB Chain version of MMT, and the total supply there is 15M.
A Binance wallet tagged as an exchange holds 14.83M tokens, or 98.86%. The top 100 wallets control 99.98%.
But that's the BNB Chain version only, so the 1B total supply on CoinMarketCap is a separate count. Even so, 419 holders is a thin base, and price swings fast when so few wallets trade.
Open Interest Now Exceeds the Whole Market Cap
Open interest, the total value of live futures contracts, is $47.93M, up 392.92% in a day. Bigger than the $44.39M market cap, CoinGlass shows.
Futures volume reached $630.31M against $82.24M on spot, a 7.7x gap. Binance holds the most open interest at $19.73M, then Bybit at $6.55M and OKX at $5.37M, per CoinGlass futures data.
But spot net flow sits at -$582.1K. Spot buyers, meaning people who take the token home, sat out. So who buys at $0.24 if that stays the same?
Short Sellers Got Squeezed Hard
Shorts got hit first. $931.26K wiped out in 1 hour, $1.07M in 4 hour, Longs lost $177.02K in that first hour.
Total liquidations reached $2.59M over 24 hours, and shorts took $1.60M of it. That's a short squeeze, where rising price forces short sellers to buy back and pushes price up further.
The funding rate, the fee that keeps futures near spot price, sits at -0.0277%. Shorts are paying longs.
But positioning is split. Binance top traders lean long at 1.6765, and regular accounts lean short at 0.8688. Big money is long, and small accounts are betting against it.
Binance, OKX, and Bybit hold most open interest, so crypto exchange listing news from those venues is the fastest catalyst to watch.
What the Momentum X Post Says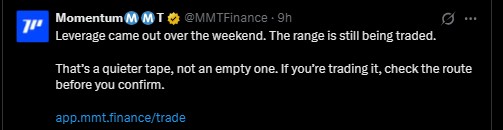
Momentum's X post said futures positions cleared out over the weekend, and the token was still trading in a range.
The team called the market quiet but active and told users to check the route before confirming a trade on its app.
MMT Price Forecast Through the 4H Chart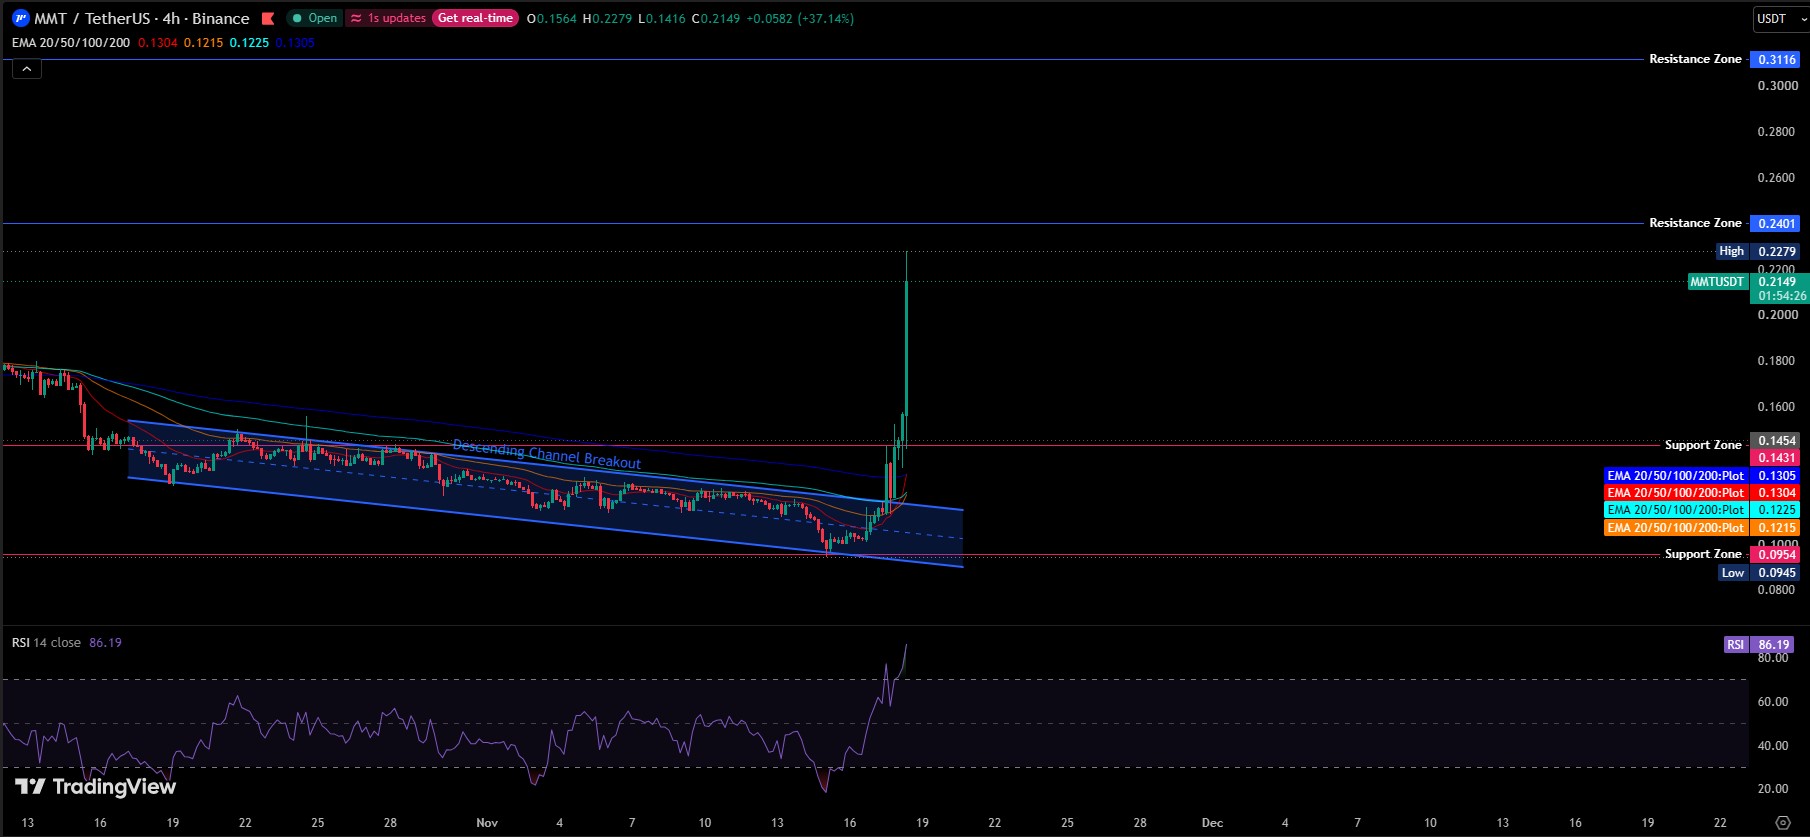
The TradingView 4H chart starts near $0.18. Price then fell to the $0.1454 and $0.1431 zones, a support area, meaning a level where buyers stepped in before.
That bounce topped near $0.155. A descending channel took over, with two falling lines that framed the price between lower highs and lower lows for nearly 3 weeks.
Selling reached the channel floor at a low of $0.0945, a hair under the $0.0954 support zone. RSI fell near 20.
Then buyers showed up. Price climbed out of the channel near $0.12 and ran through four EMAs, which are exponential moving averages that weigh recent candles more.
Those EMAs were bunched between 100 EMA at $0.1215 and 200 EMA at $0.1305, so a single big candle cleared all of them. Next came $0.1454 in a straight line, then $0.16 and $0.18.
At first this looks like a pure squeeze. Scratch that. A channel breakout plus an EMA reclaim is real structure, even if futures drove it.
The current candle opened at $0.1564, dipped to $0.1416, and ran to $0.2279. The price trades at $0.2149.
RSI is 86.19, and anything above 70 counts as overbought. Price sits about 65% above the 200 EMA at $0.1305, a gap that rarely holds. And $0.2401, the nearest resistance where sellers have appeared before, is 11.7% higher.
Momentum Price Prediction Scenarios and Targets
The structure is bullish. The entry is stretched. A pullback into the $0.1454 to $0.16 area is more likely than a straight run to $0.2401.
A hold above $0.1454 keeps the breakout valid. Below it, the $0.1305 level comes back into play.
Bulls need spot volume. If $0.2401 breaks with real spot buying, $0.3116 becomes the next stop, about 45% higher.
Scenario | Trigger | Target | Invalidation | Liquidity Condition |
Bullish | Spot volume lifts, price above $0.2401 | $0.3116 | Below $0.1454 | Spot inflow turns positive |
Base | Pullback holds $0.1454 to $0.16 | $0.2401 retest | Below $0.1454 | Futures volume cools |
Bearish | Rejection at $0.2279, loss of $0.1454 | $0.1305 | Above $0.2401 | Long liquidated, spot outflow stays |
Momentum Price Outlook and Key Levels
Levels on other tokens sit in the crypto price prediction hub, but MMT has its own map.
Support Levels
$0.1454 and $0.1431 come first. Below them sits the EMA cluster from 100 EMA at $0.1215 to 200 EMA at $0.1305, then $0.0954.
Resistance Levels
$0.2279 is the high so far. $0.2401 follows, then $0.3116.
Risks That Cap the Rally
Supply is the first risk. 204.09M tokens circulate out of 1B, and CoinMarketCap shows a liquidity-to-market-cap ratio of 0.58%, so big orders move price fast.
CoinGlass puts the Fear and Greed Index at 10, extreme fear. But headline risk matters most for thin tokens, and AI crypto news can move sentiment in hours.
Where the Momentum Setup Stands
This MMT price analysis leans bullish on structure and cautious on timing. The channel breakout is real, but futures drove it.
Targets sit at $0.2401 first, then $0.3116. The MMT price projection turns bearish if $0.1454 breaks, and the Momentum price prediction stays bullish while that floor holds.
Fast small-cap pumps are common, and the memecoin crypto news page tracks other sharp movers.
Disclaimer: This article is for information only and isn't financial advice. Crypto prices are volatile, and readers should do their own research before making any decision.