Monero Price Prediction November 2026: Will XMR Hold $515.30?


Can Monero hold the $515.30 support level or slide towards the next support level?
This Monero Price Prediction November 2026 begins with XMR trading below its broken consolidation range, and the Monero coin analysis frames why that range matters.
Monero Price Forecast: 24-Hour Market Snapshot
Per CoinGecko market data, XMR ranks 13th by market cap at $9.877B.fully diluted valuation, prices every issued coin at today's rate, and it matches market cap here.
Metric | Value |
Price | $524.69 |
7-day change | -15.5% |
24h range | $523.97 to $573.93 |
Market cap | $9.877B |
Market cap rank | 13th |
FDV | $9.877B |
24h trading volume | $169.284M |
Perps 24h open interest | $225.488M |
Circulating supply | 18.83M XMR |
Total supply | 18.83M XMR |
Source: CoinGecko market data, captured Nov 13, 2026, 04:26 UTC
XMR Support Levels: Price Sits 1.78% Above $515.30
Per CoinGecko market data, XMR fell 15.5% over the week, roughly $96. The price now sits $0.68 above the 24-hour low of $523.97.
The nearest of the XMR support levels sits at $515.30, just 1.78% below price. But the nearest resistance level at $584.06 is 11.32% above, a lopsided gap that shapes this Monero Price Prediction November 2026.
Monero Delisting News: MEXC Pulls XMR Spot Trading
A delisting means an exchange removes a trading pair, so traders can't buy or sell it there. Per the MEXC announcement, XMR and DASH spot pairs are being removed, with open orders canceled automatically.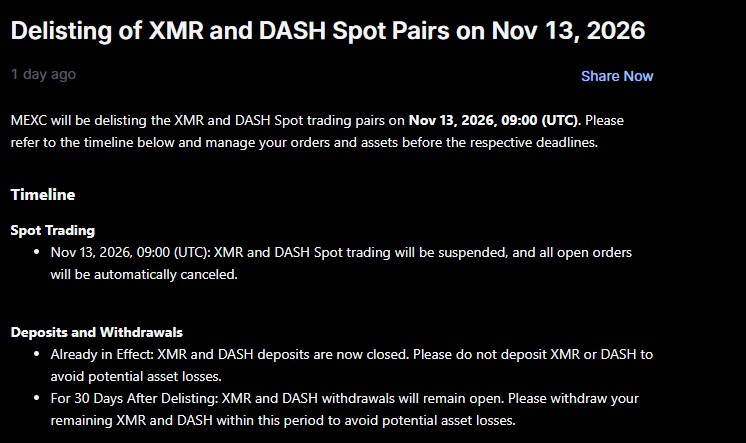
Source: MEXC announcement, delisting of XMR and DASH spot pairs, captured Nov 13, 2026, 04:26 UTC
MEXC gave no reason, so any regulatory link is speculation.
In direct terms the Monero delisting appears small, since MEXC holds only $3.41M of XMR open interest. Fresh crypto news updates will show whether other exchanges follow. If they do, spot access shrinks and liquidity thins, which can add sell pressure.
Monero Liquidation Data: Longs Lose $1.36M in 24 Hours
Longs took the hit. Per CoinGlass liquidation data, traders lost $1.38M in 24h, and 99% of it came from long positions. A liquidation is a forced exit when a trade runs out of margin.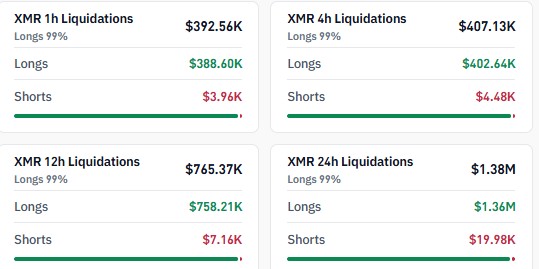
Source: CoinGlass, XMR liquidations, captured Nov 13, 2026, 04:26 UTC
The last hour was the worst. It posted $392.56K, 96% of the 4h total. Shorts barely registered at $19.98K, and forced long exits add sell orders into a falling market that pushes price toward the $515.30 support level faster.
Monero Open Interest and Futures Volume: $330.47M at Stake
Open interest is the total value of futures contracts still open. Per CoinGlass futures data, the total sits at $330.47M across exchanges. That equals about 3.35% of XMR's market cap.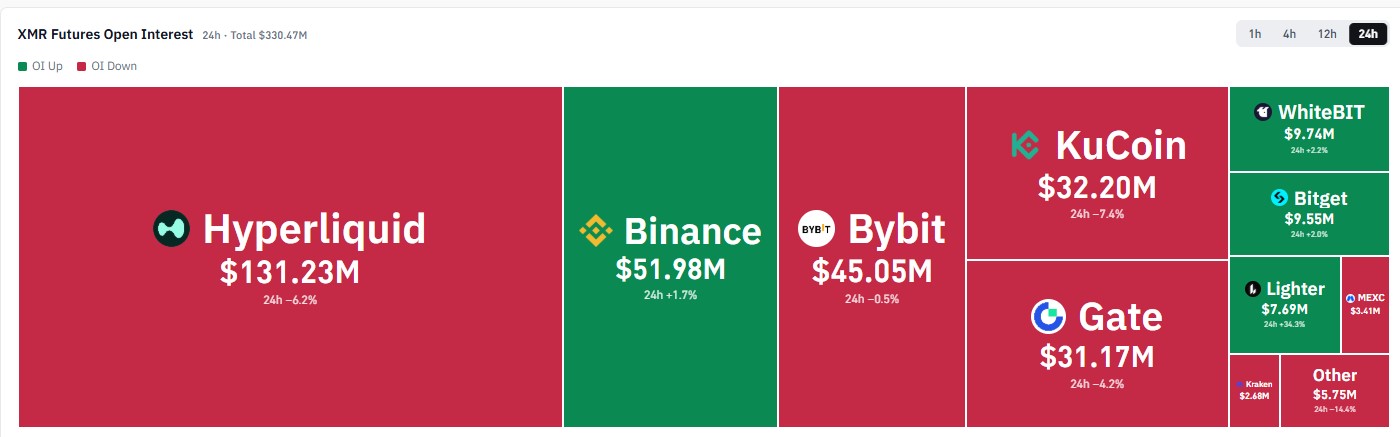
Source: CoinGlass, XMR futures open interest, 24h, captured Nov 13, 2026, 04:26 UTC
Volume is simply how much traders bought and sold in futures over 24h. It hit $296.75M, nearly twice the $169.284M of spot volume.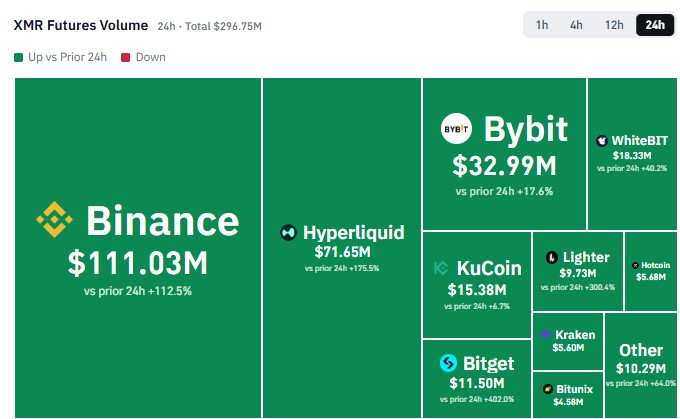
Source: CoinGlass, XMR futures volume, 24h, captured Nov 13, 2026, 04:26 UTC
Two numbers explain the move. Open interest fell on exchanges holding about 76% of the total, yet volume rose on every exchange in the heatmap.
Traders were exiting faster than new ones opened, a pattern that usually follows a flush. Falling open interest in a drop means traders are cutting positions, so selling pressure may fade once exits finish.
Monero Technical Analysis: 50-Day EMA and RSI Levels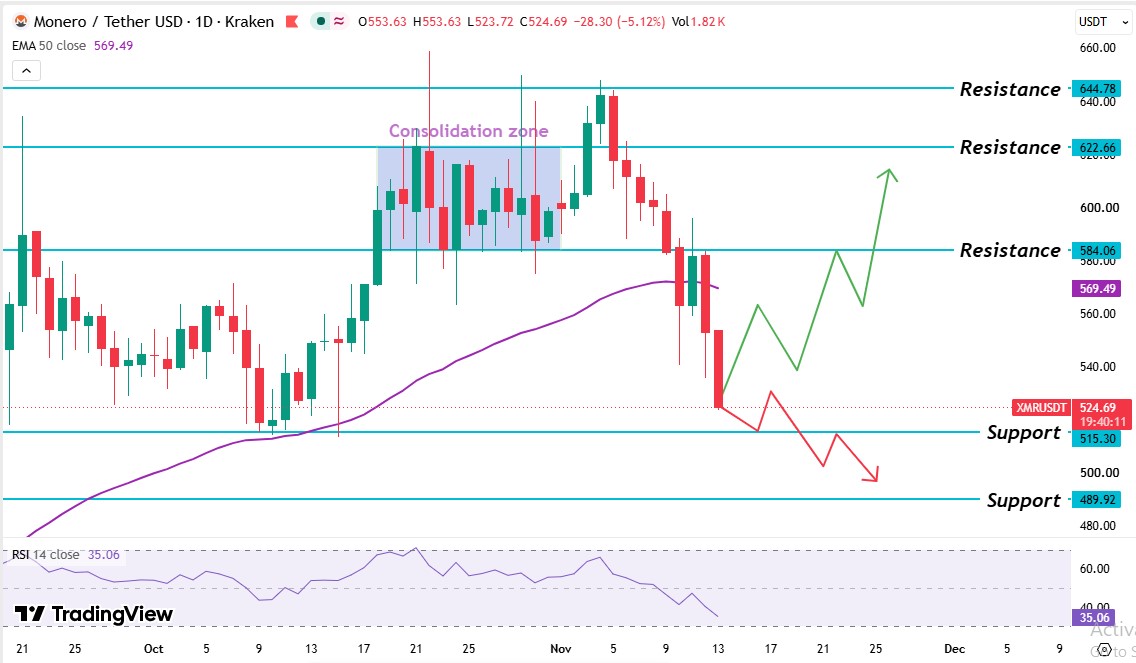
Source: TradingView, Kraken $XMR/USDT 1D chart with EMA 50 and RSI 14, captured Nov 13, 2026, 04:26 UTC
The Kraken 1D chart for $XMR/USDT on TradingView frames this Monero Price Prediction November 2026. A November rally pushed XMR up to the $644.78 resistance level before sellers grabbed control.
Before that rally, buyers defended the $515.30 support level, a price where buyers have stepped in before. From there $XMR built a range, a band held between a support level at $584.06 and a resistance level at $622.66.
Buyers tried to break above $622.66 several times and failed. The breakout finally came, but sellers rejected it at $644.78.
Then $XMR broke down. It lost the $584.06 level, now a broken support level, and slid through the $569.49 50-day EMA, a moving average that weights recent prices. The September Monero forecast adds earlier context on this market.
Right now, $XMR trades above the $515.30 support level but below the $584.06 resistance level and the 50-day EMA.
The $XMR 50-day EMA sits at $569.49, where sellers have defended. $XMR's $524.69 price trades 8.55% below it, and the latest daily candle trades below the EMA. The broken support level near $584.06 sits beside it, so a real recovery needs a candle trading above both levels.
The $XMR RSI reads 35.06 on the 14-day setting, down from a peak near 70 during the range. Under 50 means sellers hold the edge. Above 30 means oversold conditions haven't formed, so the price has room to fall.
XMR Support and Resistance Levels
Level | Type |
$644.78 | Resistance level |
$622.66 | Resistance level |
$584.06 | Resistance level |
$569.49 | 50-day EMA |
$515.30 | Support level |
$489.92 | Support level |
Support level is where buyers step in, and resistance level is where sellers do. The nearest support level is $515.30, and the nearest resistance level is $584.06.
Monero Price Forecast: Bull, Base, and Bear Scenarios
Scenario | Trigger | Target | Invalidation |
Bull | Daily candle trades above the $584.06 level | $622.66, then $644.78 | Falls back below $584.06 |
Base | Price stays between $515.30 and $584.06. | Sideways inside the range | Daily candle breaks a level. |
Bear | Daily candle trades below $515.30 | $489.92 | Daily candle trades above $569.49 |
More exchange delistings would thin spot access, and that can add sell pressure. And a daily candle trading above $584.06 would cancel the bearish case.
Expert Outlook: Monero Price Prediction November 2026
According to Coingabbar analysis, it leans bearish on this Monero Price Prediction November 2026. Price trades below the 50-day EMA, the RSI reads 35.06 with sellers in control, and longs took 99% of the day's liquidations.
The $515.30 support level carries the next move. A daily candle trading below it confirms sellers still run the trend. Any bounce that stalls near the 50-day EMA keeps the bearish case intact.
Disclaimer: This article is for information only and isn't financial advice. Traders should do their own research and risk only what they can afford to lose.