Chainlink Price Prediction: Is $9.62 the Bottom for LINK Now?


Did LINK sellers finally run out of steam?
LINK dropped to $9.62 on Binance at 06:07 UTC on November 13, 2026, while its hourly RSI fell to 26.84. That's the starting point for any Chainlink price prediction today. A past RSI oversold breakdown showed how fast these moves can turn, and bears still lead.
Chainlink Price Prediction Data Snapshot
LINK trades at $9.71 at 06:07 UTC, down 3.79% in 24 hours, with a day range of $9.68 to $10.14 on CoinMarketCap data.
Market cap sits at $7.26B, down 3.88%. Volume rose 33.22% to $321.33M. Spot volume alone is $91.52M, up 37.76%.
Chainlink Price Analysis on the Hourly Chart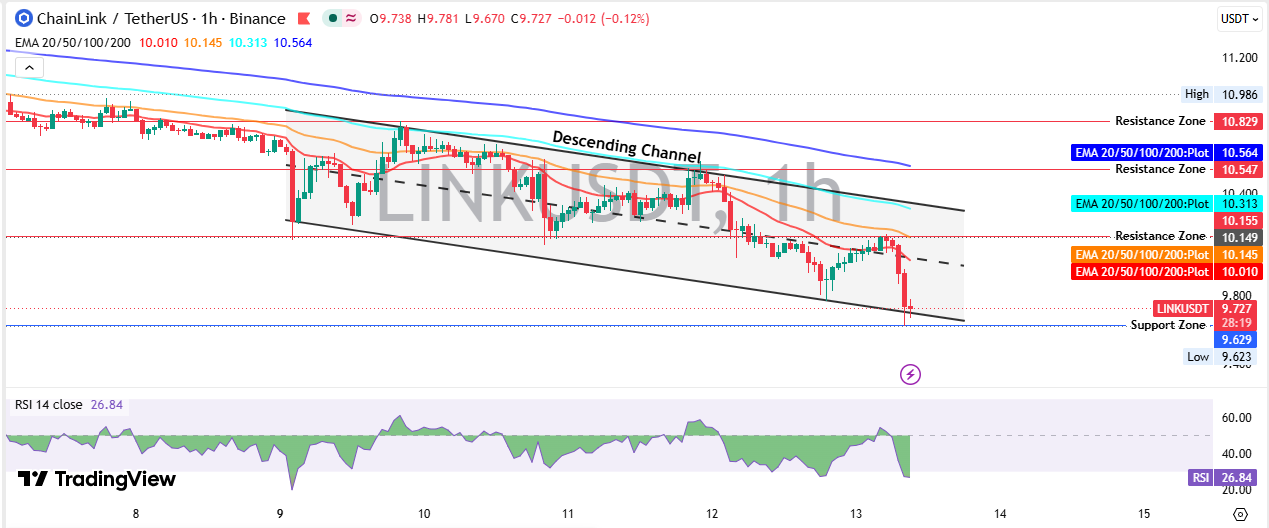
This Chainlink price analysis uses the Binance hourly chart, and the story starts near $10.98, the high marked on its left side. A hard drop came next.
Descending Channel Tests the $9.63 Floor
Sellers built a descending channel after that drop, meaning two falling trendlines drawn parallel, one over the highs and one under the lows. Rallies kept dying under the upper line. The first bounce peaked near $10.80, the second near $10.55, and the third barely reached $10.15.
Dips found buyers at lower prices too. So why would the floor hold this time?
Then a long red candle ran through the 20 EMA, a moving average that weighs recent hours more, at $10.01. It tagged the lower line at $9.62 and bounced to $9.73. Weak, really.
LINK has tested channel lines before, as an earlier channel test showed.
EMA Wall and RSI Pressure
All four EMAs sit above price. The 20 EMA is at $10.01, the 50 EMA at $10.15, the 100 EMA at $10.31 and the 200 EMA at $10.56.
LINK RSI, a 0 to 100 gauge of how fast the price moved, is 26.84 on the TradingView hourly chart. Under 30 is called oversold, meaning selling got stretched.
Sellers still own this chart. Scratch that; they own it, but they're tired.
Chainlink Open Interest and Liquidations
Open Interest and Funding Rate
Coinglass derivatives data puts LINK open interest, the total value of futures contracts still active, at $435.39M, down 6.26%.
The funding rate, a small fee longs and shorts pay each other, is 0.0025%, or 2.8% annualised. Barely positive.
Long Liquidation Flush
Liquidations hit $3.03M in 24 hours, and longs took 99%. A liquidation is a forced exit when a trade built on borrowed money runs out of margin.
Shorts barely showed up in that data. Only the longs, and they got cleared right at the channel floor.
But open interest is still $435.39M, so some borrowed-money positions are waiting to be hit. Traders saw a similar long-heavy setup in the falling wedge longs piece.
Spot LINK ETF Flows Stay Flat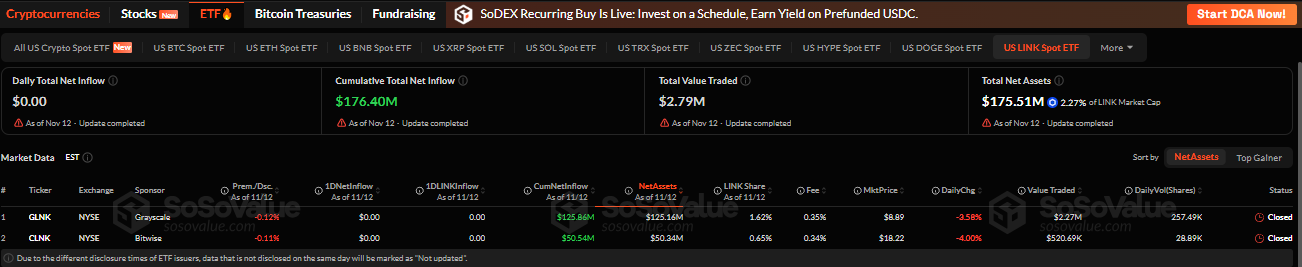
SoSoValue ETF data shows spot LINK ETF funds hold $175.51M in net assets, about 2.27% of LINK market cap.
Daily net inflow was $0.00 after the NYSE session ended at 21:00 UTC on November 12, 2026. Cumulative inflow stands at $176.40M.
Grayscale's GLNK holds $125.16M and trades at $8.89, down 3.58%. Bitwise's CLNK holds $50.34M at $18.22, down 4.00%.
Total value traded was just $2.79M. Nobody's buying this dip through ETFs.
Chainlink Holder Data on Etherscan
Etherscan holder data counts over 920,000 holders. The top 100 wallets control 60.16% of supply, and 3,479 whale wallets hold 89.83%.
Whale Supply Risk
Several top wallets carry non-circulating labels, with 30M LINK each, so not all of that supply is for sale.
Even so, one large transfer to an exchange could spook buyers, a risk covered in the whale holder analysis.
LINK Price Today in Brief
LINK tagged $9.62. RSI hit 26.84. Longs took 99% of $3.03M in liquidations.
The Fear and Greed index, a 0 to 100 score of crowd mood, sits at 21. That's extreme fear. Price is still under every EMA.
Chainlink Price Forecast Scenarios
The LINK price forecast splits into three paths, and none is guaranteed.
Scenario | Trigger | Target | Invalidation | Liquidity Condition |
Bullish | Hourly trades above $10.15 | $10.55, then $10.83 | Falls under $10.01 | Spot volume above $91.52M, ETF inflow returns |
Base | Trades hold $9.62 to $10.01 | $10.01 retest | Break of either edge | Volume near $321M, funding flat |
Bearish | Hourly trades below $9.62 | $9.00 round number | Reclaim of $10.01 | Long liquidations rise, bids thin out |
Bulls need $10.15 first. That's the 50 EMA and a marked resistance zone together, about 4.5% above $9.71. A bounce like the reserve buy bounce needs volume to follow.
Chainlink Support and Resistance Levels
Chainlink support and resistance start at the $9.62 to $9.63 floor, where buyers defended twice in the data above. Below it, the chart has no marked level, so the $9.00 round number is the next area, about 7.3% under today's price.
Resistance stacks at $10.01, $10.15, $10.31, $10.55 and $10.83. The $10.98 high sits above all of it.
Chainlink Price Outlook for the Rest of November
The Chainlink price outlook stays bearish while the price trades under $10.15. A bounce to $10.01 is likely with RSI at 26.84, but a bounce isn't a trend change. The full November 2026 outlook covers the monthly frame.
And extreme fear can last. It doesn't flip because price tags support it once.
Any Chainlink price projection for the month needs $10.15 reclaimed on rising spot volume above $91.52M.
Risks That Could Change the Chainlink Price Prediction
A break under $9.62 on rising volume cancels the bounce case, and $9.00 comes into play.
Zero ETF inflow keeps demand thin. And good news may already sit in price, as an adoption priced in view argued.
Disclaimer: This article is for informational purposes only and isn't financial advice. Crypto prices are volatile, and targets are not guaranteed. Research independently before trading.