Oil Slips to $101 as US-Iran Talk Hopes Grow: Is $105 the Next Wall?

Oil prices fell on Monday as hopes of US and Iran talks eased fears of fresh military action. WTI dropped 2.21% to $100.98 per barrel. Brent slipped 1.56% to $109.90.
Still, attacks on Saudi Arabia keep traders careful. The chart now sits near a key test, and it may shape the next move.
Why Are Oil Prices Falling Today?
Peace talk hopes are the main reason. Prices had jumped on Friday to their highest level since April. Reports said the US and Israel could prepare strikes on Iran after the US midterm elections in early November.
Brent is up nearly 90% this year on supply worries. That run left the market overbought, so some selling followed on Monday.
Experts noted that crude slipped below $102 even as fears remain. Strikes could return after Israeli elections this week and US midterms next week.
What Is the Latest News Moving the Market?
Benchmark | Price per Barrel | Change |
WTI | $100.98 | -2.21% (-$2.28) |
Brent | $109.90 | -1.56% (-$1.73) |
President Donald Trump said on Sunday he will soon decide whether to chase a deal with Tehran or restart military operations. Threats from Iran and the Houthis against Americans in the Middle East keep growing.
Iranian Foreign Minister Abbas Araghchi said the US and Israel would not attack if rationality prevailed.
Clashes between Saudi Arabia and Iran-backed Houthi rebels grew over the weekend. The Houthis said they targeted King Khalid International Airport in Riyadh after Saudi strikes on Sanaa.
There is some good news. Middle Eastern crude exports have recovered to near pre-war levels. Even so, the narrow waterway linking the Persian Gulf to global markets remains a focal point.
What Does the WTI Crude Futures Chart Show?
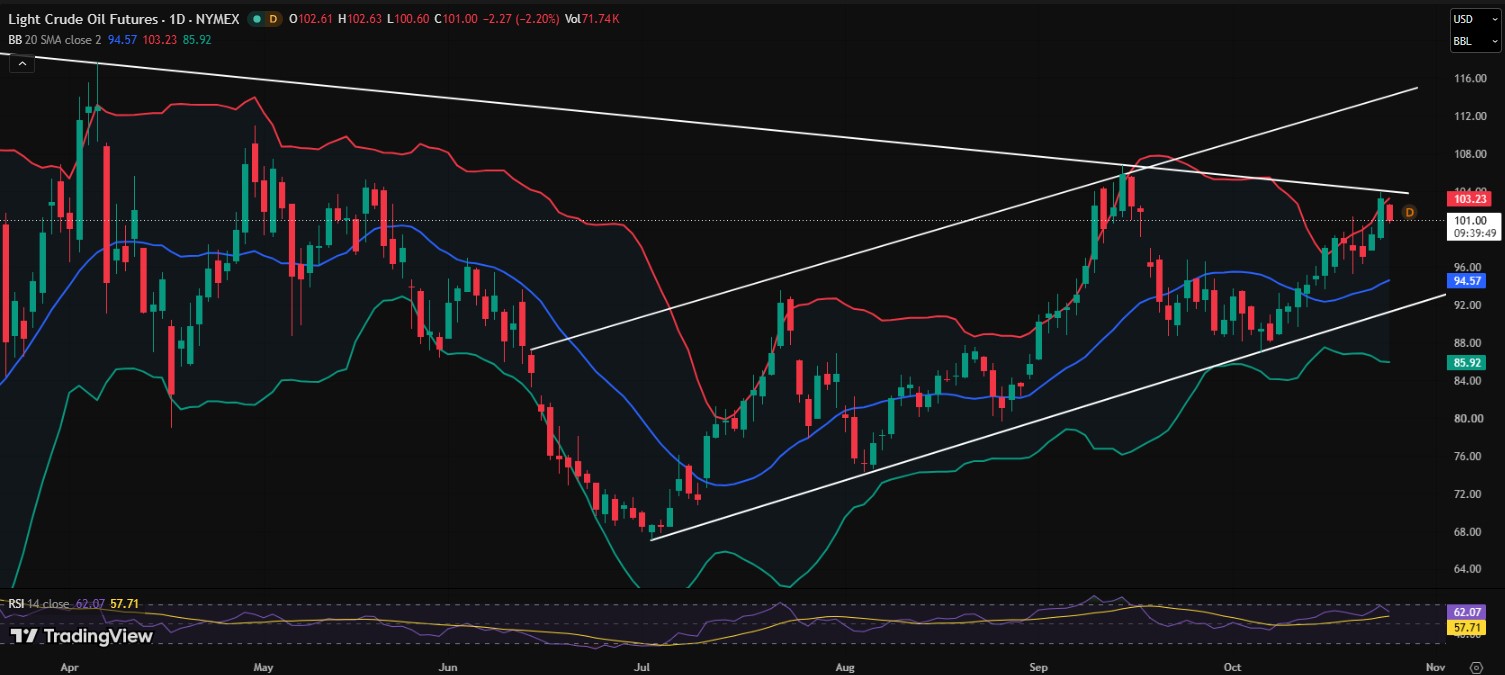
NYMEX Light Crude futures trade near $101 on the daily chart. The candle opened at $102.61, hit a high of $102.63 and a low of $100.60, then closed at $101.00. That is down $2.27, or 2.20%. Volume was 71.74K.
Price has recovered from July lows around $68 to $70 and is moving inside a rising channel. It now nears the $103 to $105 zone. The upper Bollinger Band at $103.23 and a descending trendline meet there.
The middle band sits at $94.57 and the lower band at $85.92. RSI reads 62.07, above its signal line at 57.71. That shows positive momentum, though a short-term dip is possible.
Level | Price Zone | What It Means |
Upside targets | $108 to $112 | Possible if price closes above $105 |
Resistance | $103 to $105 | Upper Bollinger Band meets descending trendline |
Bullish base | Above $96 | Keeps the outlook cautiously bullish |
Pullback zone | $98 to $96 | Possible if resistance rejects price |
Support | $92 to $94 | Rising trendline area, near the $94.57 middle band |
Weak structure | Below $92 | Bullish setup would weaken |
What Is Egrag Crypto Watching on the Oil Chart?
Analyst Egrag Crypto says he follows the chart, not the headlines. He expects more peace talks, promises, and deal talk this week.
His line in the sand is the macro descending trendline. A confirmed close above it could signal a major escalation phase, possibly lasting three months or more.
He also says this does not mean war is certain. It would only show rising escalation risk. His plan is to let the talks end, check where crude closes against the trendline, then let the chart guide him.
His chart also marks zones such as limited escalation and a mega deal.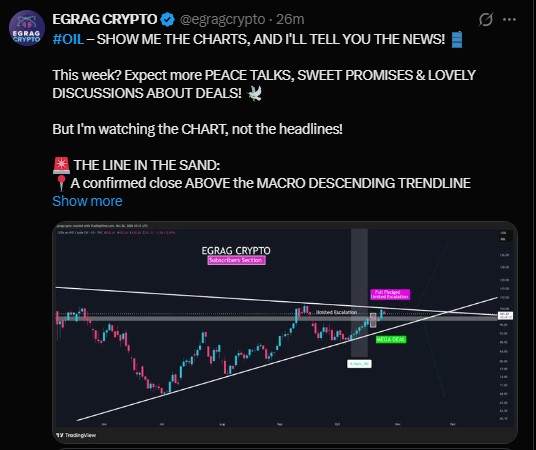
Will Oil Break Above $105 or Fall Back?
A close above $105 could open the way toward $108 to $112. That would match Egrag's trendline idea.
If sellers defend resistance, a pullback toward $98 to $96 is possible. Stronger support sits at $92 to $94 near the rising trendline. A break below $92 would weaken the bullish structure.
The outlook stays cautiously bullish above $96. Still, nobody knows if peace headlines or new strikes arrive first. Either can move prices fast.
What Events Should Traders Watch This Week?
Event | Timing | Why It Matters |
Israeli elections | This week | Strikes on Iran could resume afterward |
Trump decision on Iran | Soon | Deal or restart of military operations |
US midterm elections | Early November | Reports link possible strikes to the period after |
Saudi and Houthi clashes | Ongoing | Adds supply risk |
Close vs descending trendline | After the talks | Egrag's key signal |
Disclaimer
This article is for information only and is not financial, investment or trading advice. Commodity and crypto markets carry high risk, and prices can change fast. Past performance does not guarantee future results. Always do your own research and speak with a licensed financial advisor before making any decision. The author and publisher are not responsible for any losses.

















