Ozone Chain Price Prediction as OZO Tests $0.2180, Can It Hold?


Can a coin that barely moved for over a year really hold a 67% jump in one day?
That's the test for OZO at 03:49 UTC on Nov 12, 2026. The Ozone Chain price prediction starts with a price at $0.2180, just under a $0.2249 ceiling, and a daily RSI (relative strength index) at 97.86. Traders hunting latest altcoin forecasts won't find many setups this stretched.
What Happened to OZO Today
OZO jumped 67.24% in 24 hours. The price ranged from a low of $0.1301 to a high of $0.2230.
The OZO price today sits at $0.2180 on CoinMarketCap and $0.2184 on MEXC.
But volume is the amount actually traded. Only $482.04K.
Pumps on light books fill memecoin market news every week, and most fade.
OZO Data Snapshot
CoinMarketCap ranks Ozone Chain at #4118 with a $213.73M market cap and a fully diluted value of $218.07M, which is the cap if every token existed today.
Circulating supply is 980.85M OZO out of a 1B maximum.
Volume is up 25.8% to $482.04K, only 0.2249% of market cap. CoinMarketCap's OZO page also lists a $0.5966 all-time high and a $0.01441 low, so price sits 63.48% under the peak.
What the Official Ozone Chain Post Adds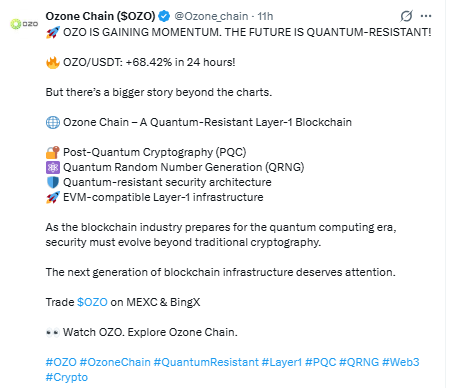
The project's X account put out an official Ozone Chain post claiming a 68.42% gain on OZO/USDT, about 11 hours before this update.
It pitches a quantum-resistant Layer-1 chain with post-quantum cryptography and EVM compatibility. And it sends traders to MEXC and BingX.
Price moved first, and the story came second. That makes the post a victory lap rather than a trigger.
On-Chain Activity on Ozonescan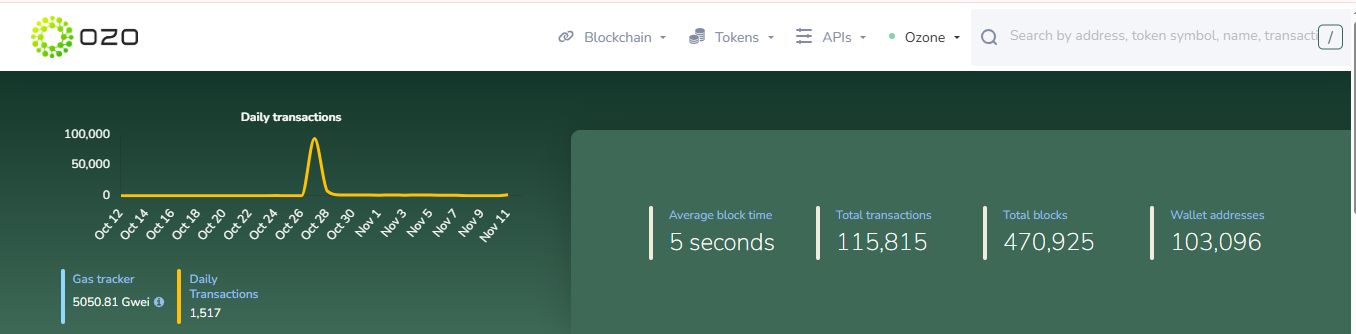
Network use is quiet. Ozonescan explorer lists 115,815 total transactions, 470,925 blocks and 103,096 wallet addresses, with a 5-second average block time.
Daily transactions now sit at 1,517. For a network valued at $213.73M. That's small.
A spike near 90,000 hit about two weeks ago and faded within days. And 1,517 a day can't justify the current price tag.
OZO Technical Analysis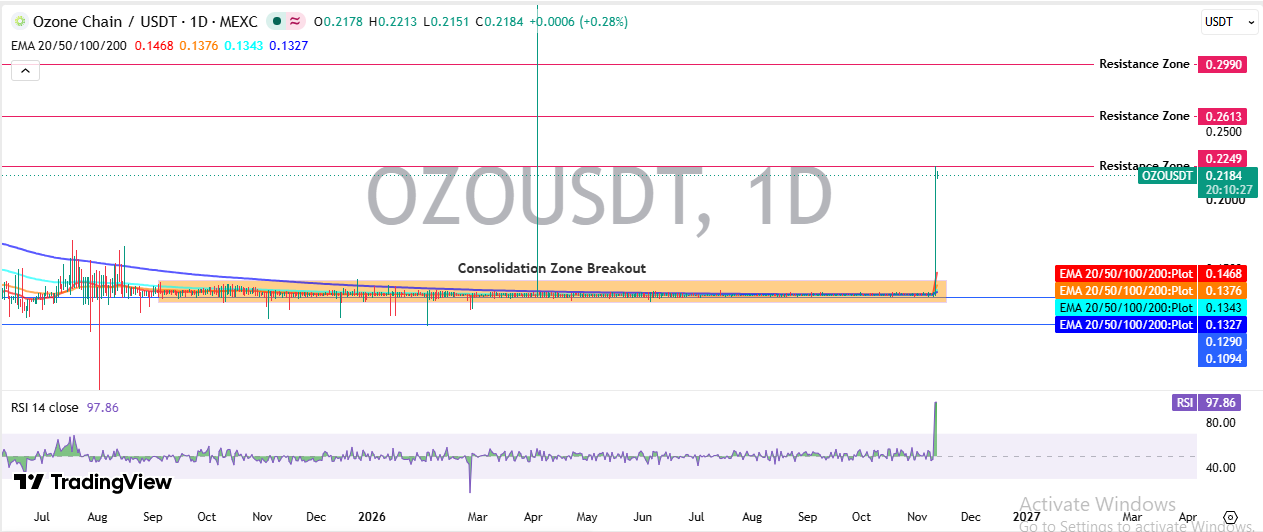
On the TradingView daily chart, price crawled sideways for over a year, staying near the 20 EMA, 50 EMA, 100 EMA and 200 EMA (exponential moving averages, lines that smooth recent prices). They now stand at $0.1468, $0.1376, $0.1343 and $0.1327.
Volatility had dried up. Then a single daily candle ran from near $0.13 to the $0.2249 resistance, a level where sellers tend to show up, and left a long upper wick, meaning buyers couldn't hold the high.
That candle settled near $0.2178. Today's candle opened there and has traded between $0.2151 and $0.2213 as of 03:49 UTC. Tiny range. No follow-through yet.
RSI at 97.86 sits far above the 50 area it hovered around all year. And price is about 49% over the 20-day EMA, a gap that usually gets pulled back toward the average.
A move this big on a chart this flat. It needs proof.
Call it a confirmed breakout. Actually, scratch that.
A real breakout, meaning the price leaves its range for good, needs a dip back to the old range top near $0.15 that holds, and none has been tested.
This $OZO price analysis stays bearish until that test passes.
Support and Resistance Levels
Resistance sits at $0.2249, about 3% above price. Next come $0.2613 and $0.2990, roughly 20% and 37% higher.
Support, where buyers tend to step in, starts at the $0.1468 20-day EMA, 33% under price. Below it sit $0.1290 and $0.1094, with no marked level between.
Ozone Chain Price Prediction Near $0.2249
Sellers own this OZO price outlook for now. Bulls need a daily candle trading above $0.2249 on volume well over $482.04K.
Volume and Exchange Liquidity
The project named MEXC and BingX as trading venues. $482.04K over 24 hours is light liquidity, meaning orders can't fill without moving price.
A few sellers hitting bids could push the price under $0.2151 fast. Fresh pairs would help, and exchange listing updates are the place to watch for them.
$OZO Price Forecast Scenarios
Bears hold the edge. A rejection at $0.2249 sends the price toward the EMA cluster, starting at $0.1468.
But for the Ozone Chain price prediction to turn bullish, a daily candle must trade above $0.2249 first, and then $0.2613 becomes the next stop. An OZO price forecast built on today's volume can't justify more.
Scenario | Trigger | Target | Invalidation | Liquidity Condition |
Bull | Daily candle above $0.2249 | $0.2613, then $0.2990 | Trades under $0.2151 | Volume above $482.04K |
Base | Range between $0.2151 and $0.2249 | Sideways drift | Candle outside either level | Flat near $482.04K |
Bear | Rejection at $0.2249 | $0.1468, then $0.1290 | Daily candle above $0.2249 | Sparse order books |
Risks That Could Reverse the Rally
Almost every token already circulates, 980.85M out of 1B, so a supply unlock isn't the threat. Demand is.
And if buyers who chased near $0.2184 start taking profit, who steps in before $0.1468? Nobody has shown up there yet.
Quantum security is a real theme. Themes like it pull quick money, the kind AI crypto news covers daily, and quick money leaves just as quickly. One failed test of $0.2249 would hand the Ozone Chain price prediction to sellers.
Longer-Term $OZO Price Projection
Any $OZO price projection beyond this week needs a base first. Reaching the $0.5966 all-time high takes a 174% gain from $0.2180, and nothing on the chart backs that yet.
Real adoption would show in transactions, and 1,517 a day isn't there. A move to $0.2613 is the first test for bulls.
Disclaimer: This article is for information only and isn't financial advice. Crypto prices swing fast, and small-cap tokens like OZO carry high risk. Do your own research before trading.