Will $0.0000045 Hold? Pepe Price Prediction After a 14% Selloff


Can a single 14% daily drop end an uptrend that's lasted months?
Selling hit PEPE hard, and the Pepe price prediction now hangs on whether buyers hold the channel floor near $0.00000450.
An earlier PEPE selloff report covers a previous drop.
The Pepe price today is $0.00000456 at 05:14 UTC on November 12, 2026, down 14.21% in 24 hours.
PEPE Market Data Snapshot
CoinMarketCap data puts market cap at $1.88B, which ranks PEPE 39th.
Spot volume, the value traded in a period, is $188.75M on CoinGlass, down 14.65%. CoinMarketCap counts $711.74M across more venues, down 7.23%.
The 24-hour range runs from $0.000004502 to $0.000005350.
Supply is fully out at 413.77T PEPE, so token releases won't add selling pressure. And holders total 607.51K.
A bounce toward $0.00000477 needs volume above the $188.75M spot level to hold.
Why Is Pepe Moving Today?
Longs got flushed.
CoinGlass derivatives data shows $2.63M in 24-hour liquidations, forced exits from losing futures trades, and 93% of it hit longs.
Open interest, the value of all open futures contracts, fell 10.46% to $338.32M.
Funding rate, the fee longs and shorts pay each other, sits at -0.0132%. Shorts are paying.
Spot saw $11.2M in net outflows. Futures lost $26.5M.
Crowded shorts and negative funding are where squeezes start. But that needs a daily trade above $0.00000477 first.
Pepe Price Analysis of the Ascending Channel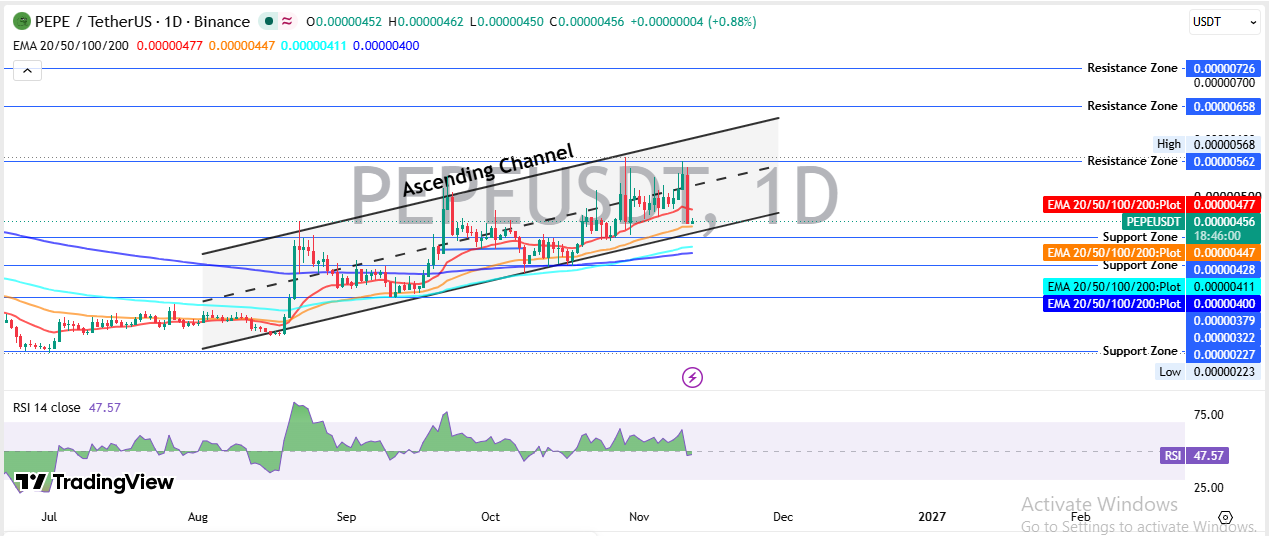
Any PEPE technical analysis starts in July 2026, when the price hits its low at $0.00000223 on the TradingView daily chart.
For weeks it chopped sideways under the 200 EMA, an exponential moving average that gives recent candles more weight.
Then a sharp rally pushed price through that level. RSI, a 0 to 100 gauge of buying strength, ran to about 80 on the push.
An ascending channel formed after that, meaning a pair of rising trendlines that hold higher highs and higher lows.
Dips kept stopping at the lower line, a support area where buyers step in. The 20 EMA, 50 EMA, 100 EMA and 200 EMA sat stacked beneath price until the latest drop.
Price then spiked to $0.00000568, the chart high, and sellers showed up near the $0.00000562 resistance, an area where rallies stall.
A long red candle followed. It eroded about 14%, sliced through the 20 EMA at $0.00000477 and the channel midline, and stopped at $0.00000450, just above the 50 EMA at $0.00000447.
Volume fell on the drop instead of rising. Sellers didn't show heavy conviction.
Right now the candle trades at $0.00000456, up 0.88% from its $0.00000452 open. RSI is 47.57, down from the high 60 at the peak, and anything under 50 means buyers lost the edge.
Calling this a breakdown is the easy call. Actually, it's early, since the lower line and 50 EMA are both intact.
But the Pepe price analysis stays bearish under $0.00000477, with $0.00000428 as the next real floor.
Whale Wallets and Holder Concentration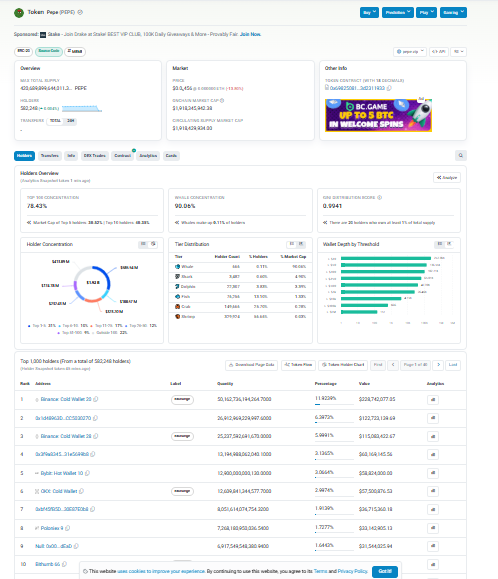
Etherscan holder data lists about 582K addresses, and a Binance cold wallet alone holds roughly 11.5% of supply.
Another Binance wallet adds about 6%, and an unlabelled address sits near 6.4%.
So who's actually buying at these levels?
The spot net flow of -$11.2M says nobody, at least over the last 24 hours.
Exchanges hold most of the top spots, so their coin flows decide how far a dip goes.
And a large transfer into Binance would put $0.00000428 in play fast.
Market Mood Around PEPE
Fear and Greed, a 0 to 100 mood gauge, sits at 29, which is Fear.
Traders in that mood rotate fast, and AI crypto news shows where attention goes instead.
A PEPE bounce needs attention back, and spot inflows would be the first proof.
Pepe Price Prediction Scenarios
More setups on other coins sit in the latest price prediction articles.
Scenario | Trigger | Target | Invalidation | Liquidity Condition |
Bull | Daily trade above $0.00000477 | $0.00000562, then $0.00000658 | Daily trade under $0.00000428 | Volume rising, funding positive |
Base | Channel floor holds | $0.00000477 retest | Daily trade under $0.00000428 | Volume flat near $188.75M |
Bear | Daily trade under $0.00000428 | $0.00000400, then $0.00000322 | Daily trade above $0.00000477 | Net outflows continue |
The Pepe price prediction favours the base case, a retest of $0.00000477 before anything else.
But a breakout, which is a push through resistance on rising volume, needs a daily trade above that level first.
Key PEPE Support and Resistance Levels
Traders who follow memecoin market news can map PEPE support and resistance from this chart.
Support layers at $0.00000450, $0.00000428, $0.00000400 and $0.00000322.
Four resistance levels stack above price at $0.00000477, $0.00000562, $0.00000658 and $0.00000726.
Pepe Price Prediction: If $0.00000428 Breaks
A daily trade under $0.00000428, 6% below the current price, opens the Pepe price projection toward $0.00000400, then $0.00000322.
And $0.00000322 would mean a 29% drop from here.
Pepe Price Forecast: If $0.00000477 Breaks Up
A daily trade above $0.00000477, 4.6% higher, shifts the Pepe price forecast toward $0.00000562.
Risks That Could Change the Pepe Price Outlook
Under $0.00000428 on a daily candle, the channel is done, and the Pepe price outlook heads for $0.00000322.
A single large Binance transfer could add selling pressure within hours.
Listings and delistings, tracked in crypto exchange listing updates, shift liquidity, meaning how many buyers and sellers sit at each price.
And any Pepe price prediction here assumes volume returns. So far it hasn't.
Disclaimer: This article is for information only and isn't financial advice. Crypto prices swing fast, and traders should do their own research before trading.