Pearl Price Prediction: Can Whales Push PEARL Past $2.46 ATH?


Can PEARL hold above $2 after a 27.58% jump in a day, or is a pullback already forming?
Buyers pushed the price to $2.41 on Gate, then stalled. An earlier channel breakdown call had the token near $0.25 in August, so it now trades roughly nine times higher.
This Pearl price prediction starts from $2.35 and a fresh descending channel breakout, a push above a falling price lane.
Pearl Price Prediction Starts With This Data Snapshot
Metric | Value |
Price | $2.35 |
24H change | +27.58% |
24H range | $1.73 to $2.40 |
Market cap | $901.79M |
24H volume | $37.65M |
FDV | $4.93B |
Circulating supply | 383.64M PEARL |
All-time high | $2.46 |
According to the CoinMarketCap, pulled data on November 19, 2026, at 08:38 UTC. Volume jumped 104.2% to $37.65M. Fast money showed up. FDV, short for fully diluted valuation, prices the full 2.1B supply, and it sits at 5.5 times market cap.
Related AI token headlines sit in AI crypto news.
PEARL Technical Analysis From Descending Channel Low to Breakout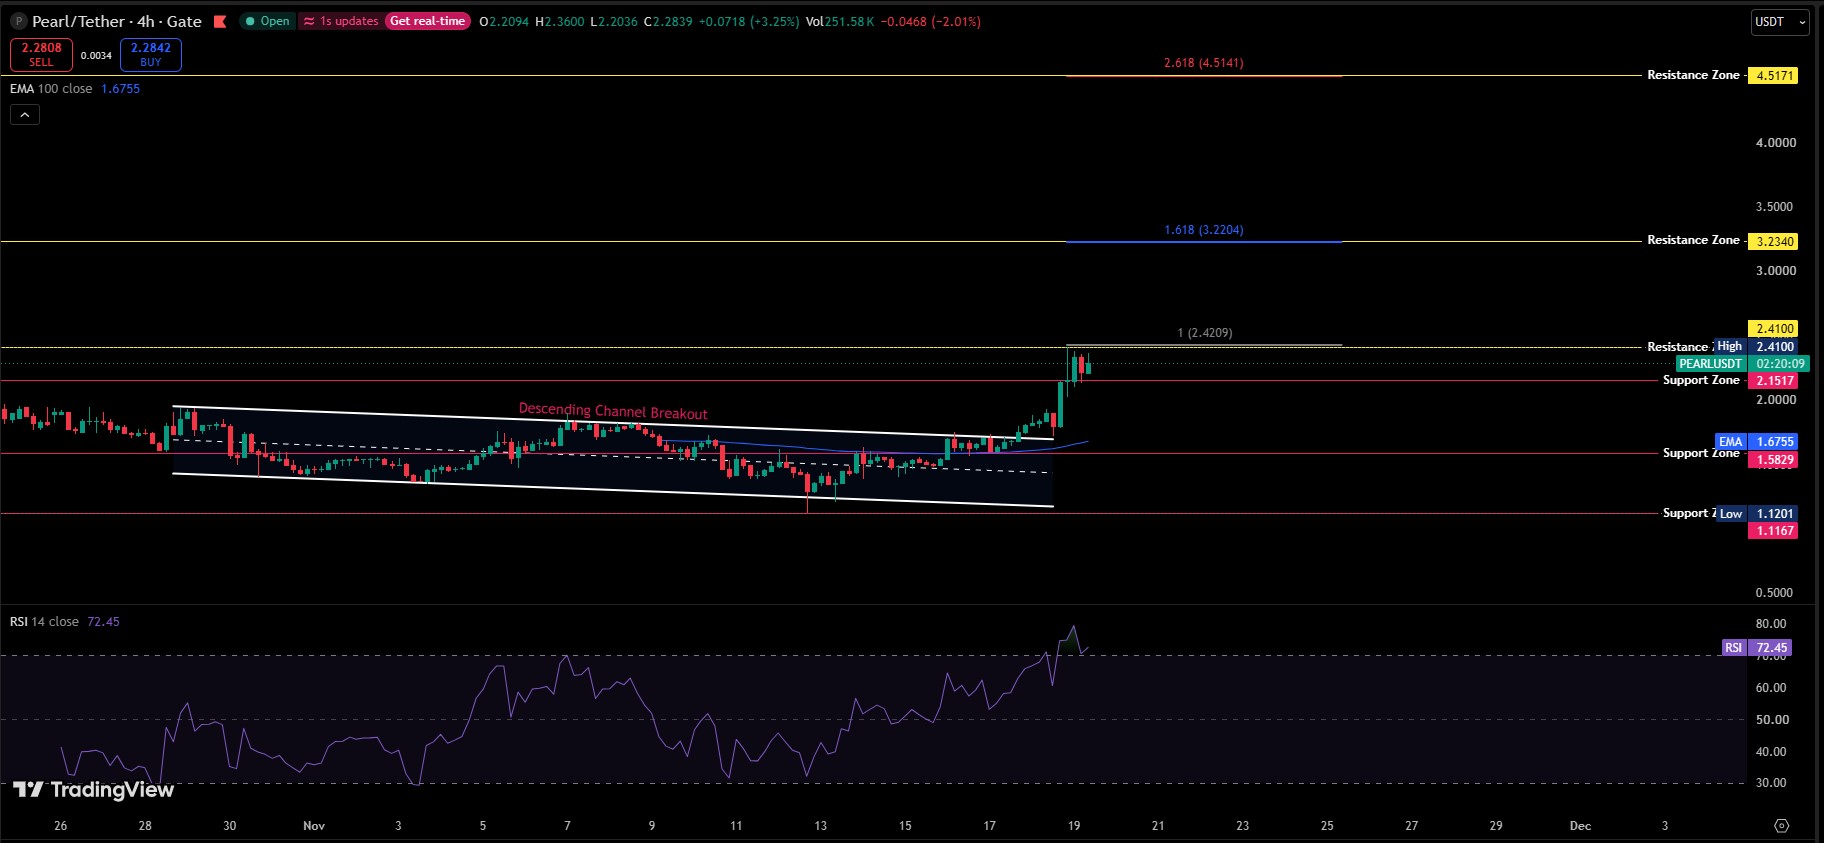
This PEARL price analysis starts with Gate's 4H TradingView chart. On Oct 28, PEARL traded near $1.90 under the channel's top line.
Bounces on Nov 7 and Nov 9 stalled near $1.80. The floor came on Nov 13 at $1.12. And buyers jumped in fast.
From there the climb was slow, pressing the $1.70 lid on Nov 15 and Nov 16.
Then the break. Around Nov 17, green candles lifted the price past the lid and the EMA 100 at $1.6755, then up to $2.15. Dips stayed shallow.
A final push on Nov 18 and Nov 19 hit $2.41, a hair under the 1 Fibonacci extension at $2.4209.
Extensions project levels from the prior swing, and this one acted as resistance, a ceiling where sellers tend to appear.
The current 4H candle opened at $2.2094, tagged $2.36, dipped to $2.2036, and trades at $2.2839 on 251.58K volume. That sits under the $2.35 CoinMarketCap price.
Support, a floor where buyers tend to defend price, starts at $2.1517, about 6% below.
RSI and EMA Behind the Pearl Price Forecast
RSI, the relative strength index, and above 70 means buyers ran hard. It's at 72.45 after touching near 80.
On Nov 7, RSI touched about 70, and PEARL dropped toward $1.12 within 6 days.
EMA 100, an exponential moving average that weights recent candles more, is turning up at $1.6755. Price sits 36% above it, and a return would cost about 27% from $2.2839.
Chase the breakout. But RSI near 72 and a 36% gap to the EMA changed that, and a pullback comes first.
Readers new to indicators can check these crypto trading terms.
What Pushed PEARL Higher This Week?
Nov 12 changed the mood. Pearl Research Labs posted a PearlQuant KV cache update. KV cache is the memory an AI model keeps per session.
It claims 65% less storage than FP8. On 8xB200 GPUs, the p90 time to first token fell from 144s to 7s. Peak throughput rose 24%. Quality matched FP8.
NEAR Protocol put PEARL live on NEAR Business, a treasury tool for crypto teams, the same day.
Whale Holdings Put 50.73% of PEARL in 53 Wallets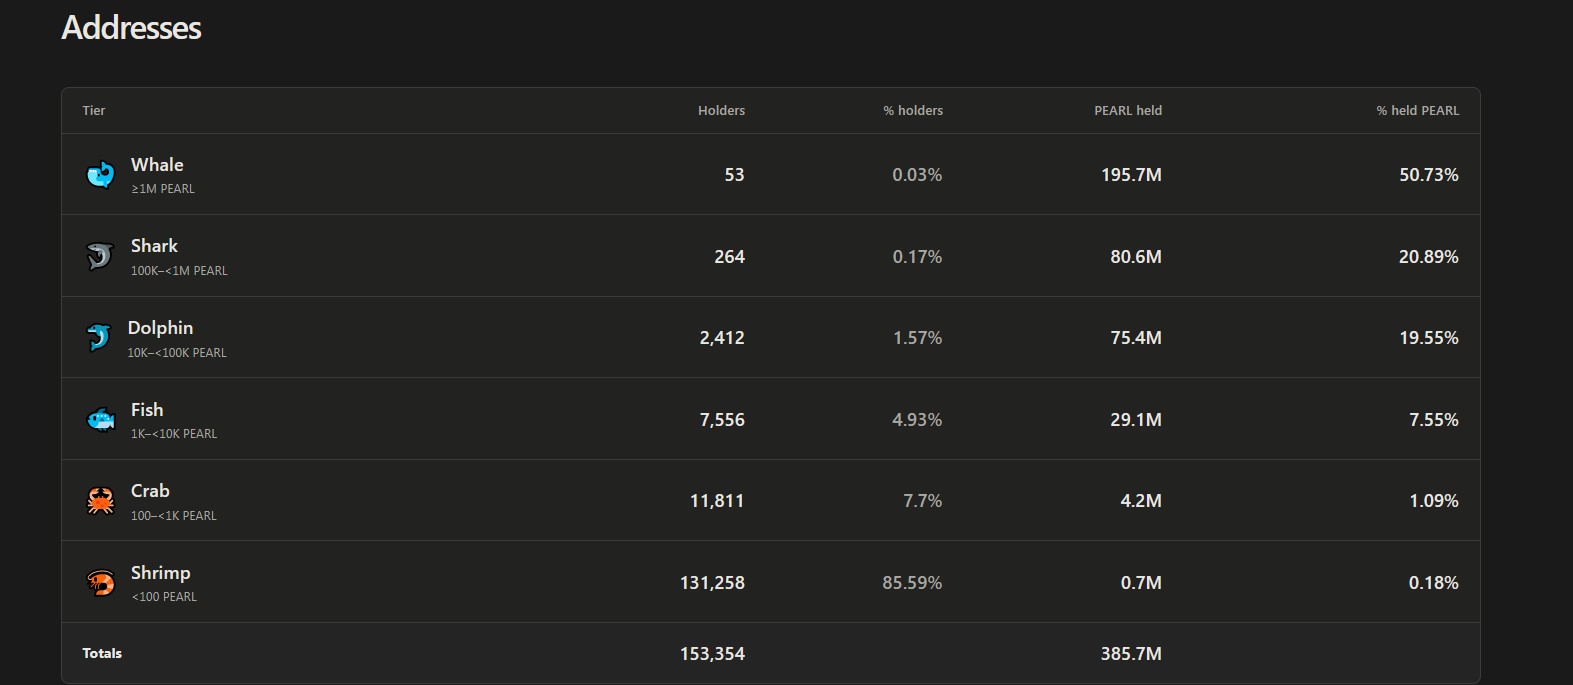
PRLScan holder data shows 53 whale wallets, each with 1M PEARL or more, holding 195.7M tokens. That's 50.73% of issued supply, about $460M at $2.35.
Add 264 sharks (100K to 1M PEARL), and 71.62% sit in 317 wallets. At the bottom, 131,258 shrimp wallets, each under 100 PEARL, hold 0.18%.
Exchange or team wallets aren't separated in the table, so some supply may not trade freely. But concentration cuts both ways.
What happens if just 5 of those 53 wallets sell on the same day? Nobody outside those wallets knows.
Miners Add Supply Every Day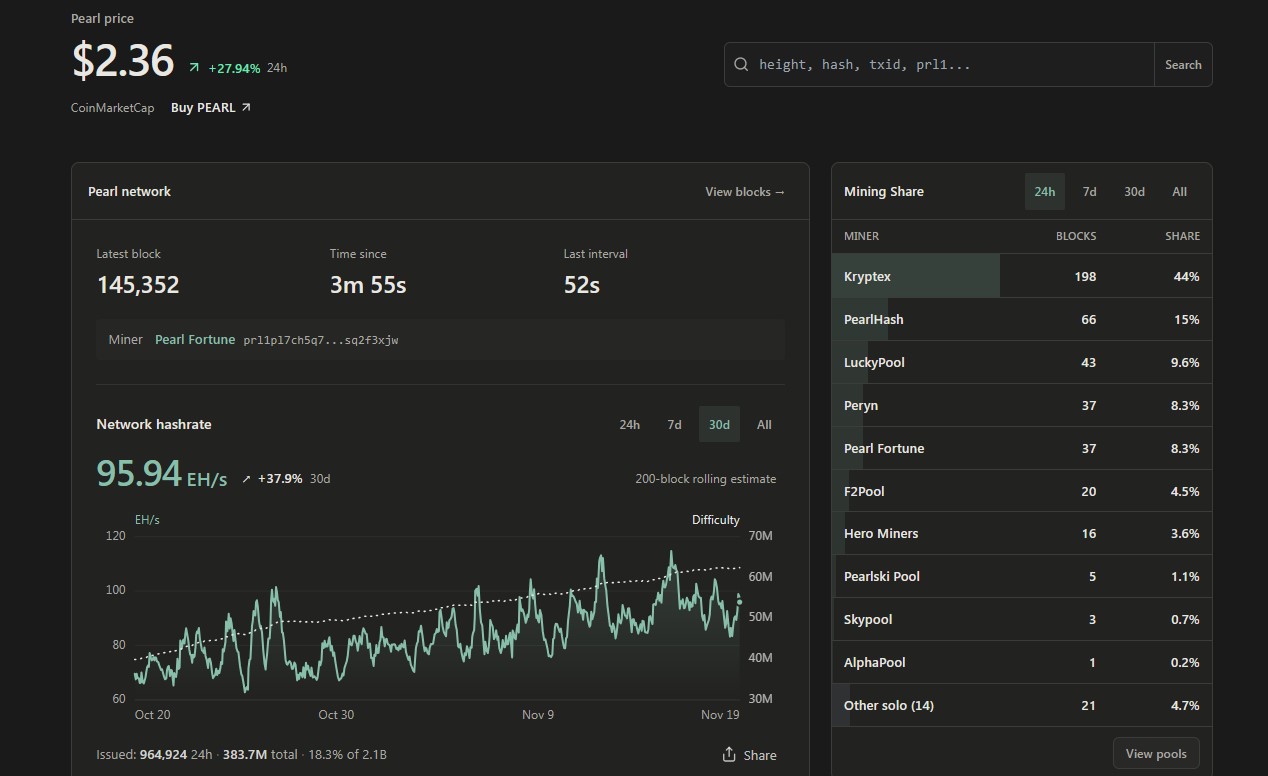
PRLScan network stats show 964,924 PEARL issued in the last 24 hours. At $2.35, that's about $2.27M of fresh supply, roughly 6% of daily volume.
Hashrate, the computing power securing the network, is 95.94 EH/s, up 37.9% in 30 days. Kryptex produced 198 blocks, a 44% share.
Small against volume today. But it never stops.
Support and Resistance Levels for PEARL
This support and resistance map is simple. Resistance starts at $2.41, then $2.4209 and the $2.46 record. Past that, the chart marks $3.2340 and $4.5171.
Support stacks below. $2.1517 comes first, then $1.6755 at the EMA 100, near the old channel lid around $1.70. Deeper floors sit at $1.5829 and $1.1201.
If buyers hold $2.15. Then $2.46 is the next real test. Lose $2.15, and $1.70 comes fast, because no marked level sits between.
Bull, Base, and Bear Cases for PEARL
Liquidity, meaning how easily orders fill without moving price, decides the path. Wider access helps, and new exchange listings would add depth.
Scenario | Trigger | Target | Invalidation | Liquidity Condition |
Bull | Trading above $2.46 on rising volume | $3.23 | Back under $2.15 | Volume above $37.65M |
Base | Range trade | $2.15 to $2.46 | Break of either edge | Volume near current level |
Bear | Loss of $2.15 | $1.68 then $1.58 | Reclaim of $2.41 | Volume fades, bids thin |
In this Pearl price forecast, the base case leads, with a bullish tilt while $2.15 holds.
PEARL Price Outlook Into Year-End
Year-end is about 6 weeks out, and this Pearl price prediction puts the first PEARL price target at $3.23, a 38% gain from $2.35. But $2.46 has to break first.
$4.52 would need a price to nearly double. Chart structure alone doesn't back that this year.
The longer PEARL price outlook depends on the AI compute mining thesis turning into paying GPU users. Until usage shows in numbers, price follows flows.
Risks That Can Break the Pearl Price Prediction
Supply first. About 82% of the 2.1B tokens aren't circulating yet, and issuance keeps adding to it. Concentration is another risk, and RSI at 72.45 adds more.
Bitcoin is the outside factor. A weak market drags altcoins down, and the Bitcoin price prediction covers that backdrop.
A full day of trading below $2.15 flips this Pearl price projection from bullish to bearish.
Disclaimer. This article is for information only and isn't financial advice. Crypto prices swing fast, and every level here can fail. Readers should research on their own before trading. Data comes from CoinMarketCap, PRLScan, and a Gate 4H TradingView chart, checked on Nov 19.
















