XRP Bollinger Band Alert: Will XRP Revert From $0.87 Support Now?

XRP trades near $0.98 and sits just above the weekly lower Bollinger Band at $0.8673.
Weekly RSI is at 36.12, close to oversold but not there yet.
Futures open interest fell 5.80% and the Fear & Greed index reads 11, extreme fear.
The XRP Bollinger Band setup comes down to one simple question. Will XRP bounce from the lower band, or slip further?
XRP is trading near $0.98, down 2.04% in 24 hours. The 24-hour range runs from $0.9537 to $1.007. The coin is now about 74.5% below its all-time high of $3.842.
XRP weekly chart: price hugs the lower band
On the XRP/USDT weekly chart, the long downtrend is still in place. Price has stayed below the 20-week middle band, which sits at $1.2415.
The upper band is at $1.6156. The lower band is at $0.8673, and price is hovering close to it.
The current weekly candle opened at $0.9741. It has traded between $0.9424 and $1.0078 so far. That long lower wick shows buyers did step in near $0.94.
Weekly RSI reads 36.12. That is weak momentum, but not yet an oversold signal.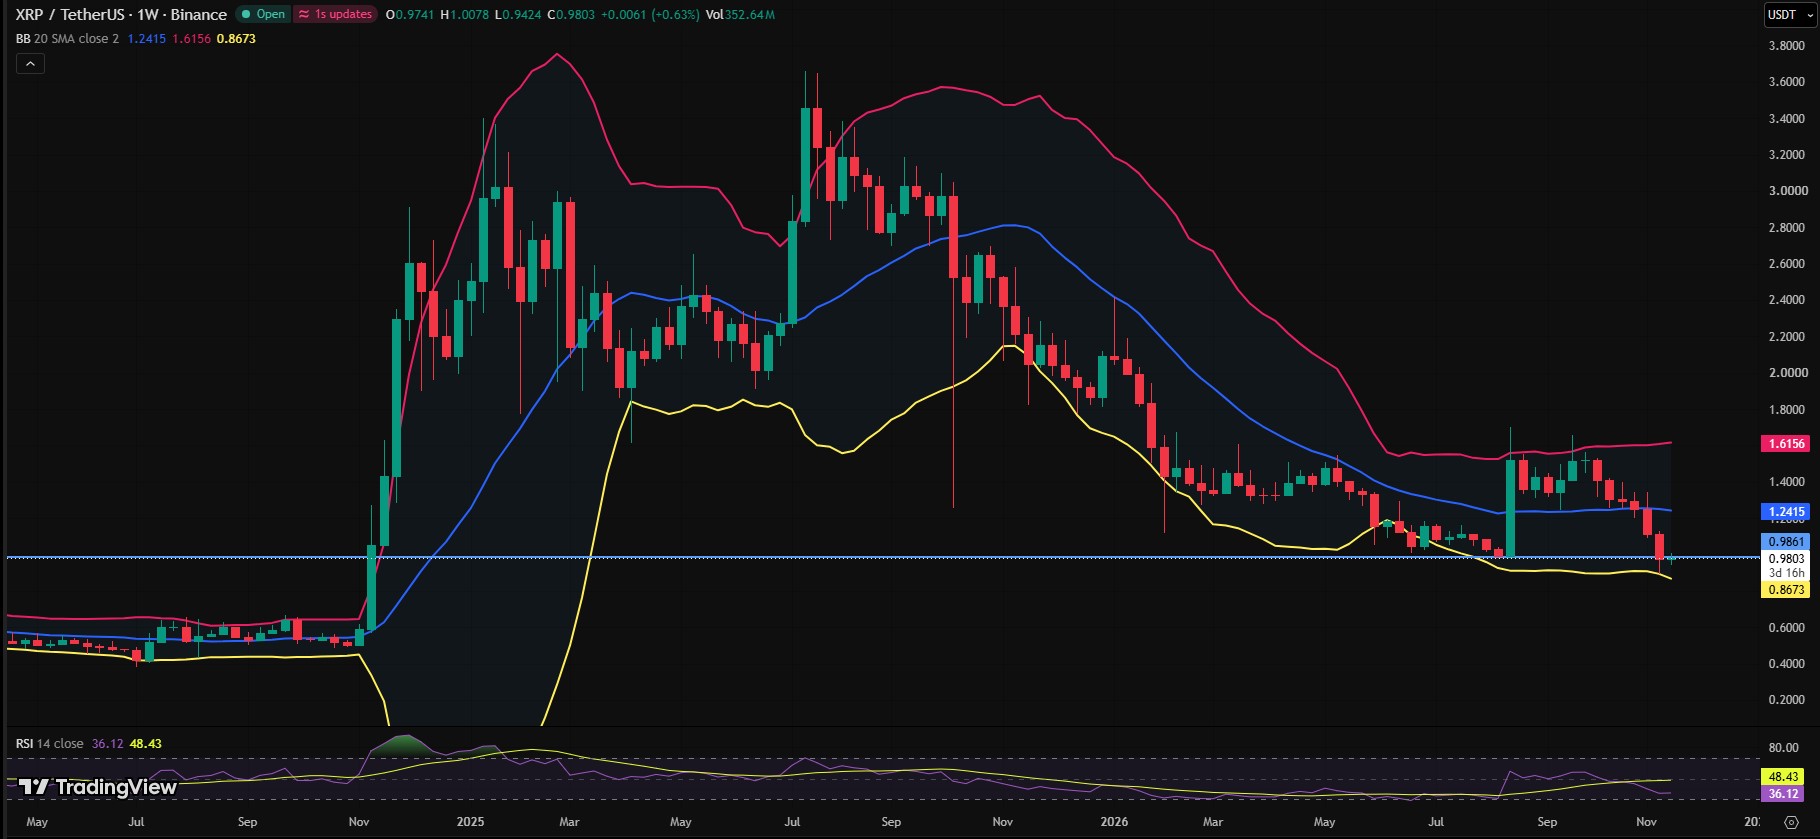
Will XRP revert from the lower Bollinger Band?
A touch of the lower band often brings a short bounce. It is not a rule, though. In a strong downtrend, price can ride the band lower for weeks.
If $0.90 to $0.87 holds, a relief move toward $1.10 to $1.25 is possible. That would take XRP back to the middle band.
If a weekly candle closes below $0.87, the picture changes. The next supports sit near $0.75 and $0.65.
Analyst ChartNerd also flagged the $0.90 to $0.70 zone. The account said it called the drop below $1.00 this year, with resistance at $1.70.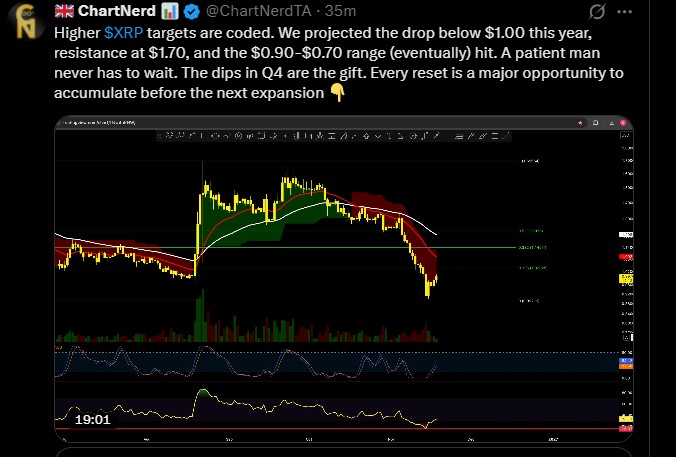
XRP futures data shows traders stepping back
Futures numbers lean cautious. Open interest is $1.94 billion, down 5.80%. Traders are closing positions, not adding new ones.
Futures volume is $2.50 billion, up 3.43%. The funding rate is slightly positive at 0.0037%, or 4.0% annualized. That is a mild long bias, nothing extreme.
Liquidations total $4.31 million over 24 hours. Longs make up $3.58 million of that, or 83%. Shorts lost $729.65K.
The Binance perp basis is slightly negative at 0.020%. The ETF net inflow reading is $0.0 for November 18.
Taker buy/sell ratios are below 1 on Binance (0.9129), OKX (0.8847) and Bybit (0.8745). Gate (1.3009) and Hyperliquid (1.1176) lean toward buyers.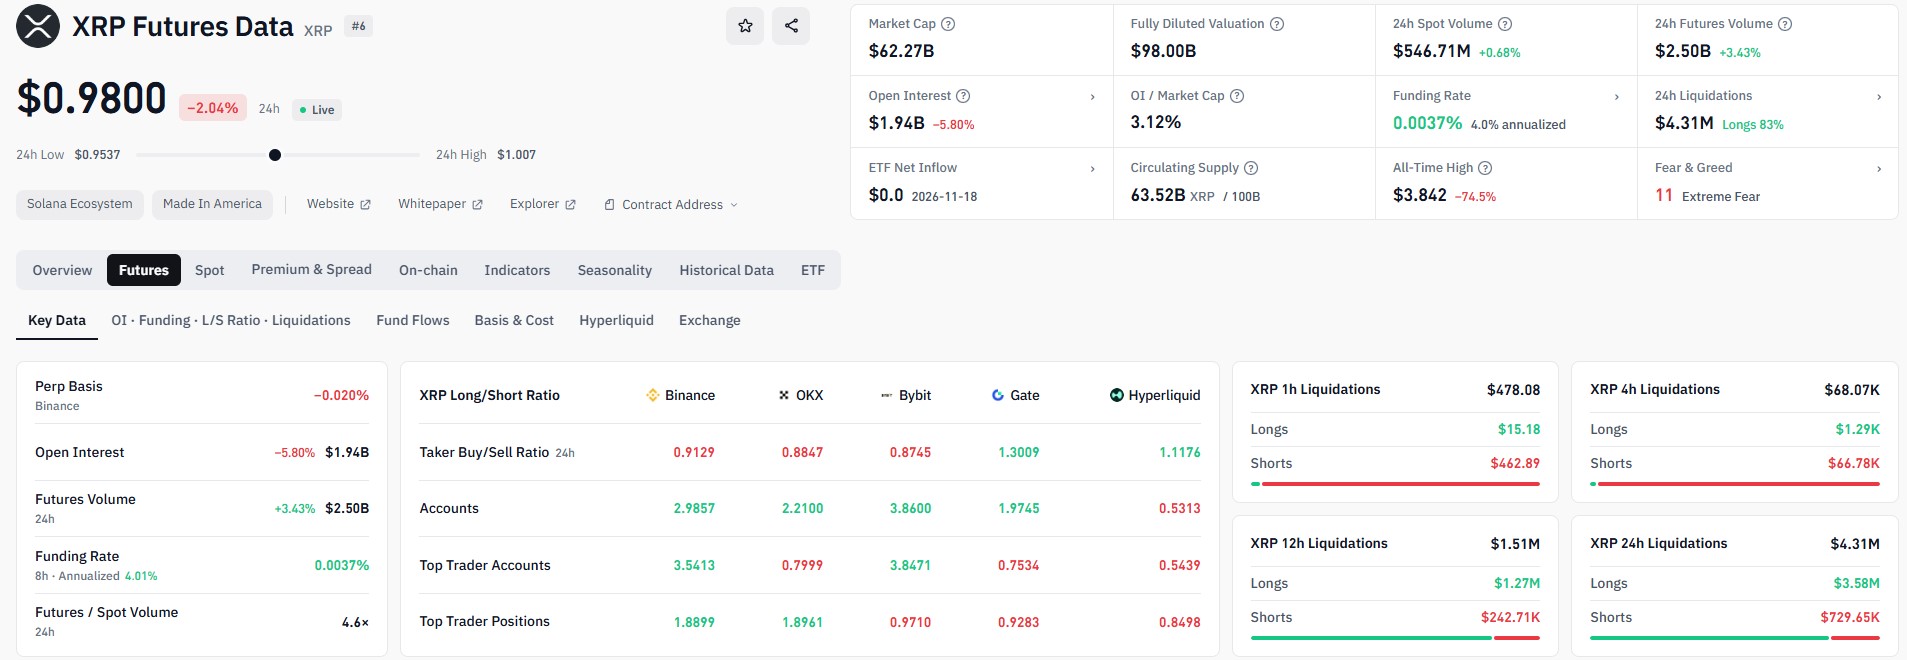
Key XRP price levels to watch
Level | Price | Why it matters |
Resistance 3 | $1.70 | Level flagged by ChartNerd |
Resistance 2 | $1.40 to $1.60 | Next major zone, upper band at $1.6156 |
Resistance 1 | $1.24 | Weekly middle band, trend recovery level |
Current price | $0.98 | 24h range $0.9537 to $1.007 |
Support 1 | $0.90 to $0.87 | Lower Bollinger Band at $0.8673 |
Support 2 | $0.75 | Possible target if $0.87 breaks |
Support 3 | $0.65 | Deeper downside zone |
XRP outlook: bounce or breakdown?
The Fear & Greed index sits at 11. Extreme fear can mark a market that is tired of selling. It can also stay low for a long time.
For bulls, the first test is a clean move back above $1.00. The bigger test is $1.24. Until XRP reclaims it, the weekly trend stays bearish.
For bears, the key is a weekly close under $0.87. That would open the door to $0.75.
The base case from the XRP Bollinger Band read is a range between $0.87 and $1.24 while the market decides. Both paths remain open.
Disclaimer
This article is for information only. It is not financial advice. Crypto prices are volatile and you can lose money. Always do your own research and speak to a licensed financial adviser before you invest.
















