Pepe Price Prediction: Whales Own 90%, Retail Waits for a Breakout


Pepe launched in April 2023, built around the Pepe the Frog meme. It grew fast. It's stayed one of the most traded meme tokens since, and that's exactly why this Pepe Price Prediction matters to so many traders watching the chart today.
The Pepe coin price today is $0.00000448. right now, up 5.6% over the past 24 hours. Not a huge move. But enough to push the price toward the top of its recent range.
Market cap sits at $1.886 billion. Fully diluted valuation lands at the exact same number, $1.886 billion, because circulating supply and max supply already match.
Turns out there's no future dilution to worry about here. All 420.69 trillion $PEPE tokens are already in circulation, which is worth flagging for anyone reading this Pepe Price Prediction 2026 update with supply risk on their mind.
Live Market Data Snapshot
Metric | Value |
Price | $0.00000448 |
24h Change | +5.6% |
24h Range | $0.000004221 - $0.000004525 |
Market Cap | $1.886B |
Source: market data taken from CoinGecko, as of Sep 25, 2026. Figures may vary slightly across other tracking websites.
Nearly $379 million in 24-hour volume on a token this size. That's not quiet. Traders are actually here right now, not just watching from a distance.
Holder Concentration Data
Here's the thing about PEPE's ownership. It's concentrated. Heavily.
The top 100 wallets hold 76.88% of the total supply. Whale wallets, meaning the largest holders, make up just 0.11% of all addresses. But that tiny group controls 90.06% of the market cap.
Nineteen wallets alone hold at least one percent of the supply each. Small number. Big weight.
Tier | Holder Count | % of Holders | % of Market Cap |
Whale | 671 | 0.11% | 90.06% |
Shark | 3,310 | 0.56% | 4.82% |
Dolphin | 21,563 | 3.65% | 3.38% |
Fish | 79,568 | 13.48% | 1.37% |
Crab | 162,070 | 27.46% | 0.33% |
Shrimp | 323,080 | 54.74% | 0.03% |
Source: Data Taken From Etherscan, as of Sep 25, 2026
The Gini Distribution Score reads 0.9938, a measure of how unevenly tokens are spread across wallets.
Higher means more concentrated. And 0.9938 is about as concentrated as this kind of score gets.
When we pulled the top-five wallet breakdown, one number jumped out immediately: 27.85%.
Five wallets. More than a quarter of $PEPE's entire market cap is sitting in five places.
Does that change anything for the price today? Not on its own. But it's the kind of number that matters the moment any of those wallets move.
Technical Analysis
PEPE sits inside a descending channel on the 4-hour chart, a structure that forms when price keeps printing lower highs and lower lows between two falling trendlines.
Right now, the price is trading against the upper boundary of that channel. This is the test.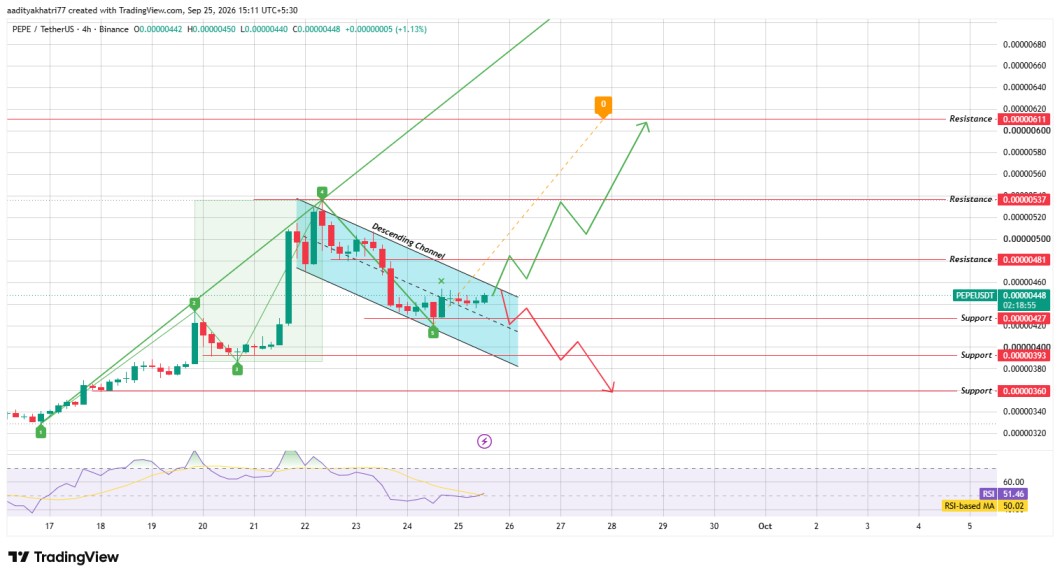
Source: Chart taken from TradingView, as of Sep 25, 2026
RSI, a momentum reading that shows how fast and how far price has moved, sits at 51.46. Its moving average reads 50.02. Neither number is extreme.
Just steady. But steady doesn't mean quiet. $PEPE has climbed since the low near $0.0000039 that printed on September 24, and it's climbed inside this same channel the whole way.
Can $PEPE Break the Channel and Push Toward Resistance?
If PEPE trades above the channel's upper edge and clears the first resistance at $0.00000481, the setup turns bullish. A move through that zone on strong volume opens the door toward $0.00000537.
And if buying holds up past there, $0.00000611 becomes the next stop. That's a real jump from where price sits today.
Here's the thing. This Pepe Price Prediction leans bullish on this one. The price is at the top of its range, the RSI is climbing rather than fading, and the setup favors buyers more than sellers right now.
What Happens If $PEPE Gets Rejected at the Channel?
Rejection is still on the table. If PEPE fails at the upper boundary and turns back down, the first support sits at $0.00000427.
A break below that level opens the door to $0.00000393. And if that fails too, the price could slide toward $0.00000360.
Turns out the whole thing comes down to one factor at the breakout attempt. Not sentiment. Not headlines. Volume.
Pepe Coin Support and Resistance Levels
Support | Resistance |
$0.00000427 | $0.00000481 |
$0.00000393 | $0.00000537 |
$0.00000360 | $0.00000611 |
$PEPE Bull, Base, and Bear Scenarios
Scenario | Setup | Level |
Bull | Channel breakout confirmed with strong volume | $0.00000481 - $0.00000611 |
Base | Price continues ranging inside the channel. | $0.00000427 - $0.00000481 |
Bear | Rejection at the boundary, support breaks | $0.00000393 - $0.00000360 |
$PEPE and the Broader Crypto Market
Meme coins like $PEPE tend to move with the market's overall risk appetite. When Bitcoin holds steady or climbs, meme tokens usually get more room to run with it.
But $PEPE also carries its own retail-driven trading base, separate from Bitcoin's larger institutional flows. And that base can push volume around in ways bigger coins rarely see.
Exactly why $PEPE's swings tend to look sharper than the majors on any given day.
Methodology
This Pepe Price Prediction is built on the 4-hour PEPE/USDT chart, covering channel structure, support and resistance zones, and RSI momentum.
Pricing data came from live exchange feeds. Holder concentration numbers came from an on-chain analytics snapshot taken close to publish time.
None of this is financial advice. It's a read of the chart and the data sitting in front of us right now.
Expert Opinion
Analysts who follow meme coin cycles often point out that descending channels forming after a strong rally tend to resolve upward once the price tests the boundary more than once.
PEPE has tested this level before without breaking it cleanly. That's the pattern worth watching here.
A clean break this time, backed by volume, would carry far more weight than the earlier attempts did.
Disclaimer: This article is for informational purposes only and does not constitute financial advice. Cryptocurrency markets are highly volatile, and prices can fall well below the levels discussed here. The price levels above are based on technical analysis and are not guaranteed outcomes. Readers should conduct their own research and consult a licensed financial advisor before making any investment decisions.

















