Pheasant Network Price Falls 16%! Can 20K PNT Transfer Shifting Trend?


The Pheasant Network Price has dropped to $0.0394, down 16%, while the project promotes 20,000 PNT Transfers as a sign of momentum.
This Pheasant Network News update checks whether that activity shows up in the market data.
It also reviews a public sale post, tests whether any Pheasant Network Listing is confirmed, and builds a Pheasant Network Price Prediction from chart levels.
PNT Live Snapshot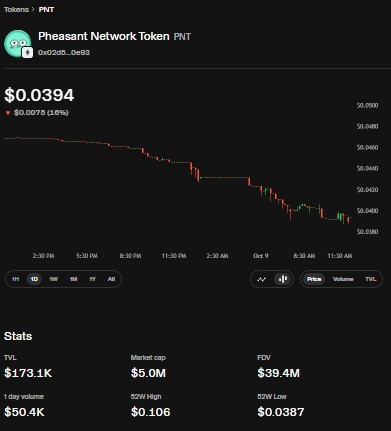
Source: PNT token market dashboard, captured October 9, 2026
Price: $0.0394
24H Change: -$0.0075 (-16%)
TVL: $173.1K
Market Cap: $5.0M
FDV: $39.4M
1-Day Volume: $50.4K
52-Week High: $0.106
52-Week Low: $0.0387
Why Is the PNT Price Falling?
The dashboard chart shows a steady slide through the day. The 24-hour change implies a start near $0.0469.
Price then moved down through the $0.0460, $0.0440 and $0.0420 grid lines before settling near $0.0394. A small bounce appears at the end, but the PNT price trend remains down.
No cause for the drop appears in the sources reviewed. This Pheasant Network Crypto News report therefore treats the fall as unexplained.
What Did the 20,000 Transfers Post Say?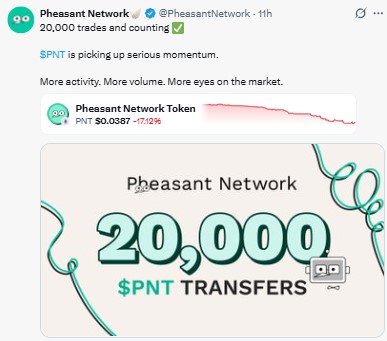
Source: Official account (@PheasantNetwork) on X, captured October 9, 2026
The post says "20,000 trades and counting." It describes the PNT token as picking up serious momentum, with more activity, more volume, and more eyes on the market. The graphic reads "20,000 $PNT TRANSFERS."
The wording differs. The text says trades, while the graphic says transfers. A transfer moves tokens between wallets. A trade swaps them on a market. The post gives no split, no time frame, and no count of buyers versus sellers.
The embedded price card shows $0.0387, down 17.12%. The dashboard shows $0.0394 and 16%, so the two appear to come from different capture times.
Can PNT Transfers Change the Price Trend?
Transfer counts show wallet activity. They do not show buying demand, since selling also creates transfers. The post pairs 20,000 transfers with a fall of 16% to 17%, so activity and price are moving in opposite directions today.
For a real shift, the chart would need to rise in price with higher PNT trading volume across several sessions. The 1-day volume of $50.4K is only about 1.0% of the $5.0M market cap. In this Pheasant Network price analysis, the dashboard does not yet show the pattern needed for a PNT price recovery outlook.
What Did the Public Sale Post Say?
Source: Official account (@PheasantNetwork) on X, captured October 9, 2026
The post links an article titled "$PNT Public Sale Concludes with 5.01x Oversubscription."
The visible text says deposits reached $751,520 against a $150K allocation. The graphic also shows "Successful 99.52%." The sentence on participants is cut off, so the rest is not confirmed.
The math holds, since $751,520 divided by $150,000 is about 5.01. Oversubscription shows demand for the sale. It does not show demand on the open market afterward.
Is a Pheasant Network Listing Confirmed?
No. Neither post names an exchange, a trading pair, or a date for a Pheasant Network listing. The dashboard shows market data, but the trading venue is not named in the screenshot.
Four steps stay separate: public sale close, token distribution, an exchange listing announcement, and actual exchange trading. Only the first is shown as complete. A Pheasant Network listing would need the exchange itself to confirm a named pair and a deposit and withdrawal date.
What Does the Market Cap Gap Show?
Market cap is $5.0M, while FDV is $39.4M. FDV is about 7.9 times market cap. By simple arithmetic, only about 12.7% of the full supply is counted in market cap.
That implies roughly 127 million tokens in circulation out of about 1 billion. Both figures are derived from price, not stated by any source. Unlock schedules are not shown, so future supply cannot be sized.
Pheasant Network Price Prediction: Chart Levels
The Pheasant Network Price Prediction tables use the current $0.0394, the 52-week low of $0.0387, the grid lines at $0.0420, $0.0440, and $0.0500, the implied day-start price of $0.0469, and the 52-week high of $0.106.
The outer bear and bull points use 0.75x and 1.5x of the current price. All ranges are pattern-based estimates, not guaranteed outcomes.
Pheasant Network Price Prediction Table 1: Near-Term Scenarios
Scenario | Price Range | Change vs. $0.0394 | Key Driver |
Bear Case | $0.0296 – $0.0387 | -24.9% to -1.8% | The slide continues, and the 52-week low gives way with no catalyst. |
Base Case | $0.0387 – $0.0440 | -1.8% to +11.7% | Price steadies near $0.0400 as volume holds around $50.4K. |
Bull Case | $0.0469 – $0.0591 | +19.0% to +50.0% | The day's losses are recovered, and volume and TVL rise for several sessions. |
Pheasant Network Price Prediction Table 2: Event-Linked Outlook
If This Happens | Implied Range | Reasoning |
Transfers continue; volume stays near $50.4K. | $0.0387 – $0.0420 (-1.8% to +6.6%) | Activity without rising volume leaves price near its low. |
The $0.0387 support breaks. | $0.0296 – $0.0387 (-24.9% to -1.8%) | The 52-week low is lost, and the screenshots show no chart support below it. |
Price reclaims $0.0469 on rising volume. | $0.0469 – $0.0500 (+19.0% to +26.9%) | The day's drop is reversed and the $0.0500 grid line comes into view. |
An exchange confirms a pair and date. | $0.0500 – $0.0591 (+26.9% to +50.0%) | Independent access and wider liquidity could support a stronger move. |
Pheasant Network Price Prediction Table 3: Gain and Loss Math
Price Level | Multiple vs. $0.0394 | Change |
$0.0197 | 0.50x | -50.0% |
$0.0296 | 0.75x | -24.9% |
$0.0387 (52-week low) | 0.98x | -1.8% |
$0.0394 (current) | 1.00x | 0% |
$0.0469 | 1.19x | +19.0% |
$0.0591 | 1.50x | +50.0% |
$0.0788 | 2.00x | +100.0% |
$0.106 (52-week high) | 2.69x | +169.0% |
The downside rows are included on purpose. A fall to $0.0197 would halve the current value. A return to the 52-week high needs a gain of about 169%, and price now sits about 62.8% below it.
What Should Readers Watch Next?
Three items matter for Pheasant Network latest news and Pheasant Network market activity. First, whether $0.0387 holds. Second, whether volume stays above $50.4K for several sessions.
Third, whether an exchange names PNT in its own announcement. The 20,000 PNT transfers latest update from project posts cannot answer the third item. Until then, any PNT Pice Prediction rests on an unconfirmed catalyst.
Disclaimer
Informational purposes only, not financial advice. Pheasant Network's posts promote 20,000 transfers and a concluded public sale. Neither confirms an exchange, trading pair, or listing date. Transfer counts do not confirm buying demand. Volume is low relative to market cap, so price can move sharply on small trades. All Pheasant Network Price Prediction ranges are pattern-based estimates, not guaranteed outcomes. Cryptocurrency carries a significant risk of loss.













.webp)




