SUI Price Prediction: Is a 10x Rally Near as Altcoin Breakout Looms?


Sui just landed on two separate altcoin watchlists making the rounds on crypto Twitter, and traders are paying attention.
One well-followed account named SUI among a handful of top picks heading into a possible altcoin breakout, while another called SUI's pullback a buying opportunity for the mid to long-term.
This Sui Price Prediction looks at what the chart, the EMA support, and the liquidation data say about whether that call has real legs.
Sui is a Layer 1 blockchain built for high-speed transactions, according to the project's own materials. Stick around till the end.
Sui Price Today: Market Snapshot
Metric | Value |
Price | $1.0732 |
4H Change | -5% |
EMA 200 | $1.0119 |
Why Is SUI’s Price Down Today?
Sui price today is down 5% to $1.0732 in 24h, underperforming a slightly negative broader market, primarily driven by a technical breakdown from key support levels.
Primary reason: Technical breakdown below crucial Fibonacci and moving average support, confirmed by high selling volume.
Secondary reasons: Underperformance versus a weak Bitcoin, likely due to macro-driven risk reduction and profit-taking after a strong 30-day rally (+30.45%).
What Traders Are Saying About SUI
A trader on X flagged that SUI alongside ETH, LINK, TAO, and ZIG as a top pick heading into a possible altcoin breakout.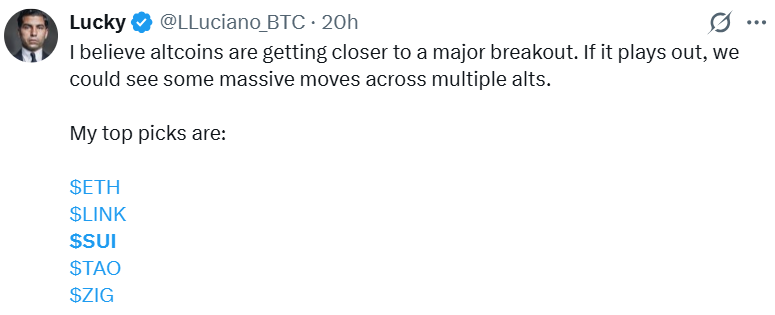
A separate account called SUI's pullback is a chance to build a position, pointing to the $1.00 to $1.10 zone as a buying area and $1.42 as the level bulls need to clear to confirm strength, with a mid to long-term view calling for a potential 10x or more from this zone.
Source: Data From X
SUI Liquidation Data: What the Last 24 Hours Show
Liquidations tell an interesting story here. Over the last 24 hours, $11.23M was wiped out, with longs taking the bigger hit at $10.58M against just $648.50K in shorts, pointing to a sharp drop at some point in that window.
But the picture flips in the shorter timeframes: over the last 4 hours, $150.33K was liquidated, almost all of it shorts at $148.85K, and the 12-hour window shows a similar lean toward short liquidations at $165.14K.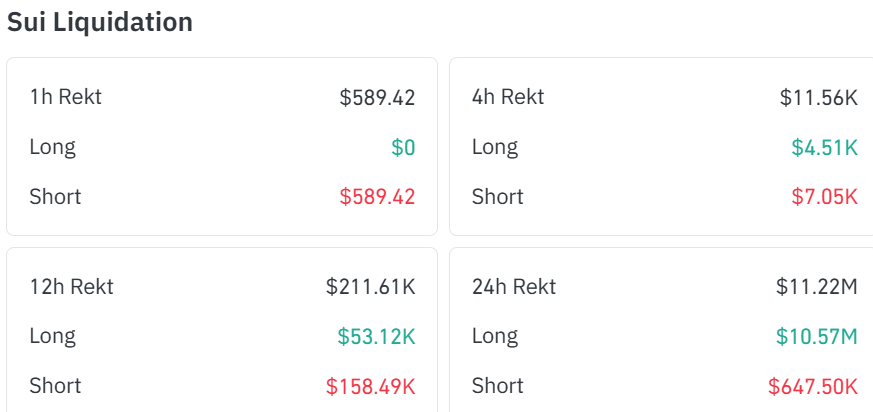
Source: Data From CoinGlass
That shift suggests the heavy long flush happened earlier in the day, followed by a bounce that caught short sellers off guard.
SUI Price Chart: Technical Analysis
SUI price today is trading at $1.0732, down 5% slightly today after pulling back from a late-September high near $1.30. Price has been stepping down in a controlled way since that high, not collapsing, and is now holding in a zone it has tested before.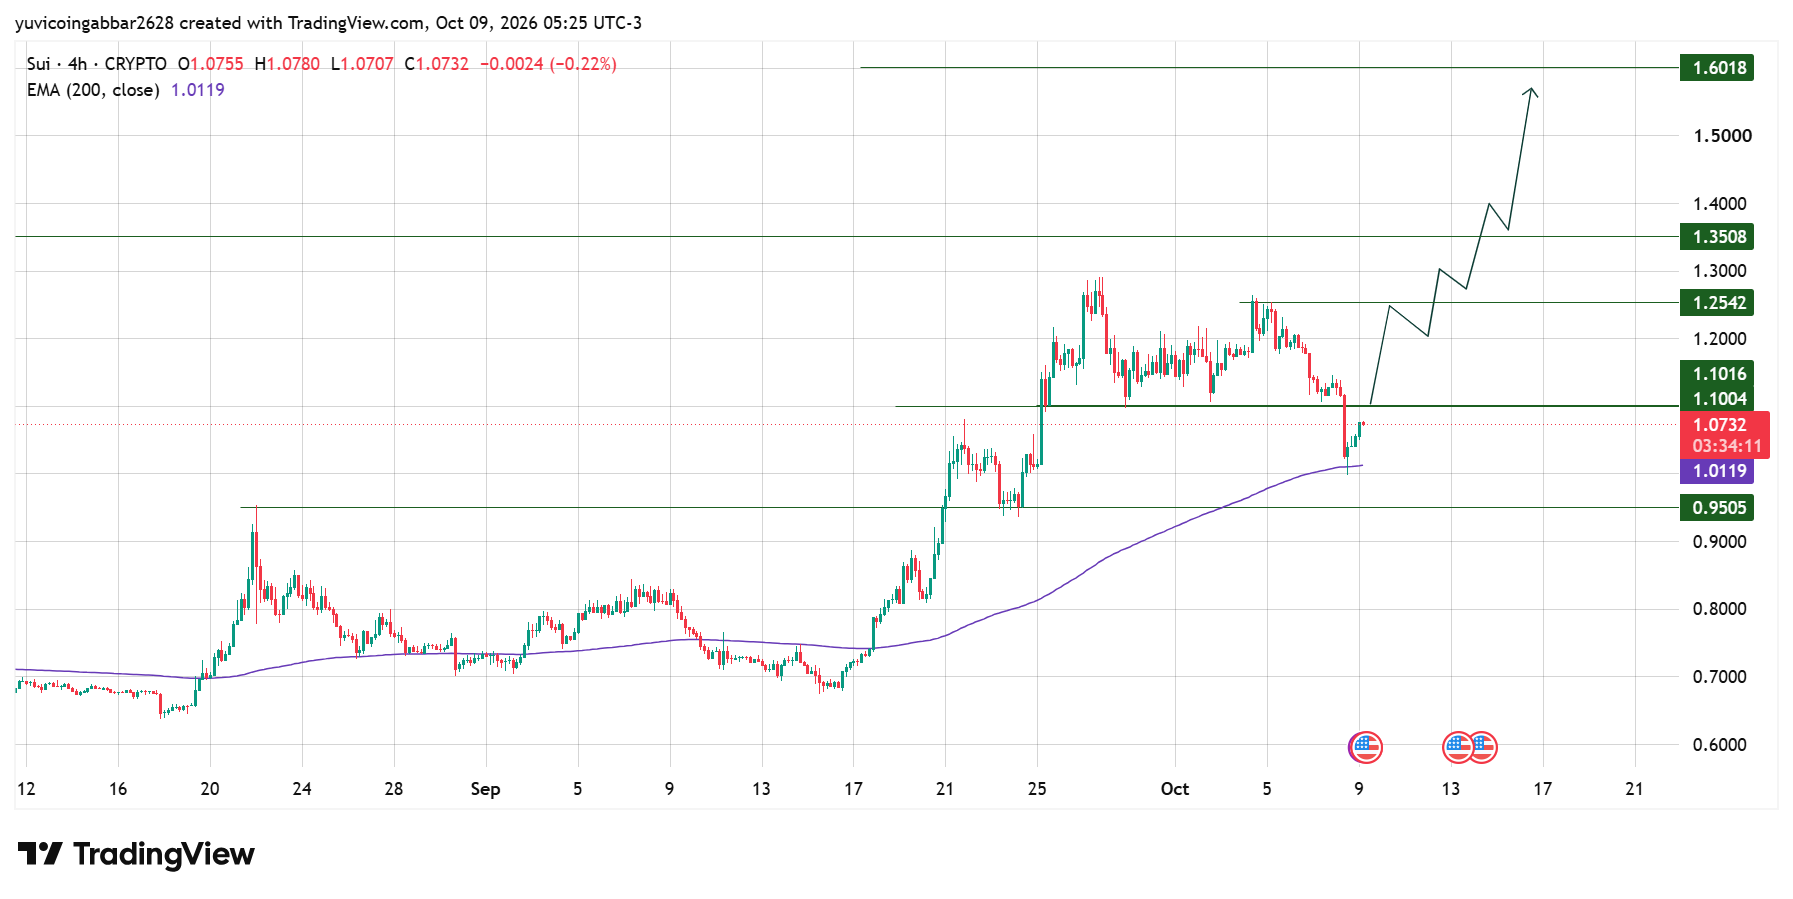
The 200 EMA at $1.0119 sits just below as support and has held through the whole move, so this pullback still reads as a cooldown inside an uptrend rather than a reversal.
SUI Outlook: Support and Resistance Levels
Level Type | Price |
Resistance 3 | $1.6018 |
Resistance 2 | $1.3508 |
Resistance 1 (nearest) | $1.2542 |
Immediate Price Reference | $1.0732 |
Structural Floor | $0.9505 |
Sui Forecast
Bull case: Holding above the 200 EMA near $1.0119 and clearing $1.1016 would support the case the pullback is over. A confirmed break above $1.2542 opens the path toward $1.3508.
Bear case: A break below $1.0119 would put the support structure in question, with $0.9505 the next level to watch if selling picks up.
Sui Price Prediction: Can SUI Reach $1.6018?
$1.6018 is the highest resistance marked on the current chart. Getting there would need SUI to first clear $1.2542, then $1.3508, a multi-stage move rather than a single leg, and still a long way from the current price near $1.07.
Sui Price Prediction 2026: Expert View
According to CoinGabbar analysts, the liquidation data points to a shakeout followed by a bounce, not a clean breakdown. Holding above the 200 EMA keeps the structure intact, and the social attention SUI is getting right now adds short-term volatility either way.
Disclaimer
This isn't financial advice, just a read of the chart and data as they stand today. Crypto markets move fast and social media calls can be wrong, so treat these levels as things to watch rather than guarantees, and size any position around your own risk tolerance.

















