Pieverse Price Forecast: Can Buyers Retest the $3.59 ATH Today?


Why would a token surge on a day when fear rules the market, and who's really buying it?
That's the question behind this Pieverse price forecast, and the answer sits in exchange data more than on the chart. Earlier Pieverse levels already mapped the floors and ceilings, so this update follows the money instead.
Pieverse Price Forecast Data Snapshot
$3.40 on Nov 22, 2026, at 05:08 UTC, up 21.54% in 24 hours. CoinMarketCap data puts the day's range at $2.80 to $3.49.
Market cap is $1.02B. FDV, or fully diluted valuation (every token valued at today's price), is $3.4B, and only 300.35M of 1B tokens circulate.
Volume fell 17.61% to $89.6M, about 8.7% of market cap. That's light for a 21% jump.
And liquidity, meaning how easily orders fill without moving price, sits at 0.31% of market cap.
How Far Is the Pieverse All-Time High?
4.44%. That's the gap between $3.40 and the Pieverse all-time high of $3.59, set on Nov 19, 2026.
A Pieverse ATH retest would be the first test of that peak since then. The recent HTX and Poloniex listings added venues, yet volume keeps falling.
The token traded at $0.1145 on Nov 14, 2025, so it's up 2,900% from that low. Plenty of profit sits near an obvious exit.
Pieverse Technical Analysis From Range to $3.43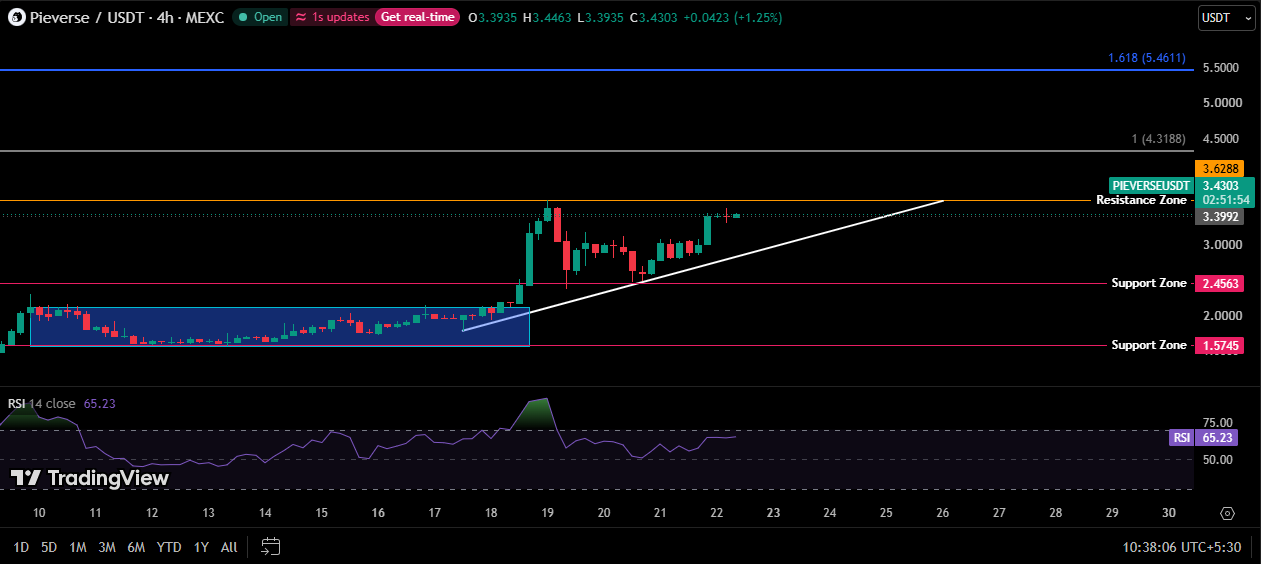
The TradingView 4H chart on MEXC starts in a tight range, meaning sideways trade, between $1.5745 and about $2.10. That held from Nov 10 to Nov 18.
Price crept up inside it and leaned on a rising trendline, a line joining higher lows. On Nov 18 and Nov 19, a run of large green candles carried it to $3.6288.
But sellers answered at that level with a long red candle. Price fell to the $2.4563 support, a floor where buyers stepped in, and bounced.
A second dip held higher, near the trendline. Buyers then pushed to $3.43 by 05:08 UTC on Nov 22, 2026.
RSI sits at 65.23, under the 70 overbought line.
Flat top, rising floor. That's an ascending triangle, a pattern where highs stay level and lows climb, and it squeezes price toward a decision.
Pieverse Support Levels
The two Pieverse support levels that matter are $2.4563 and $1.5745. The first held the pullback from $3.6288, and the second is the floor of the range that started the rally.
A 4H trade under $2.4563 ends the higher-low pattern.
Pieverse Resistance Levels
Pieverse resistance starts at $3.6288, the MEXC high from Nov 19, and a touch above the $3.59 record on CoinMarketCap. Fibonacci extensions, ratios traders draw to estimate where a move stalls, sit higher at $4.3188 and $5.4611.
Can Pieverse reach $4.32? Buyers have to get through $3.6288 first.
Which Exchanges Are Driving Pieverse Open Interest?
Futures contracts worth $178.72M are open, up 17.53% in 24 hours, per CoinGlass futures data. That Pieverse open interest figure equals 17.38% of market cap.
Binance leads at $44.78M, up 26.9%. KuCoin holds $36.47M, Gate $27.13M, Bybit $21.04M, and OKX $17.25M after a 32.7% jump.
But MEXC is the odd one. Its $15.25M is down 17.7%, so traders on the venue behind the chart above are cutting exposure while rivals add.
Futures volume reached $516.26M, up 22.88%, with OKX at $126.55M and Binance at $114.19M.
Net inflow into futures was 17.96M, led by Hot coin at +8.25M, and OKX was at +$5.42M.
Funding rate, the fee longs pay shorts when buyers dominate, is 0.0213% per 8 hours, or 23.4% annualised.
Why Is Pieverse Up Today? Squeeze or Real Demand?
Shorts got hit. Of the $609.85K in 24H liquidations, $534.52K came from shorts, about 88%. That's a small Pieverse short squeeze.
Spot stayed quiet. Volume fell 27.68% to 32.29M. Netflow was -1.5M. Futures took in $17.96M.
The rally is futures-led. Back at $1.95, the earlier futures-led rally showed the same split, and the spot still hasn't taken over.
Borrowed money is carrying this move.
What Pip Adds to the Pieverse Story
An official Pieverse post introduced Pip, a personal AI agent for Web3 that handles wallets, apps, networks and interfaces in one place.
Pip is the obvious trigger on paper. Then again, spot volume fell 27.68%, so buyers aren't rushing in.
Market Mood Around PIEVERSE
Fear and Greed sits at 10, Extreme Fear, on CoinGlass. Pieverse is rising into that, which is relative strength.
And relative strength fades fast if Bitcoin breaks lower. Risk appetite in small tokens often shows first in memecoin crypto news.
Pieverse Price Forecast Scenario Table
This Pieverse price forecast leans bullish above $2.4563, but only with spot help. Similar futures-led setups on other tokens sit in the latest price predictions.
Scenario | Trigger | Target | Invalidation | Liquidity Condition |
Bullish | 4H trades above $3.6288 | $4.3188, then $5.4611 | Rejected at $3.6288 again | Spot volume rises |
Base | Holds $2.80 to $3.49 | Sideways range | Trades above $3.6288 or under $2.4563 | Futures volume near $516M |
Bearish | 4H trades under $2.4563 | $1.5745 | Reclaims $2.80 | Longs unwind, open interest falls |
What Could Change the Outlook
Spot depth is the missing piece. A new venue adds it, and exchange listing updates carry those announcements.
Risks That Could Flip This Setup
410.77K holders sounds broad. But only 300.35M of 1B tokens circulate, and the BscScan token page shows how balances are spread.
Borrowed positions cut both ways. A drop under $2.4563 puts longs at risk of forced selling, and liquidity at 0.31% of market cap makes exits slower.
Where the Rally Stands Now
Price trades under $3.6288 with RSI at 65.23, and sellers have capped it there once already. The Pieverse price forecast stays bullish above $2.4563.
But a clean break of the ceiling needs spot volume, and that isn't there yet.
Pieverse sits in the AI agent corner of crypto, so AI crypto news is worth checking before the next 4H candle.
Disclaimer. This article is for information only and isn't financial advice. Crypto prices swing fast, and losses can be total.