Polkadot Price Prediction: Analyst Eyes 66% Rally as Pattern Breakout


Polkadot just went vertical. DOT is up 11.96% in the last 24 hours, sitting at $1.1197, significantly outperforming a modestly positive broader market.
But there's something bigger hiding in the chart: DOT has broken out of the same falling channel pattern twice before, and both times it ran hard.
This Polkadot Price Prediction breaks down why the chart is now flashing a third breakout and what kind of move that could point to.
Polkadot Price Prediction Today: Market Overview
| Metric | Value |
| Price | $1.1197 |
| 24h Change | +11.96% |
| Market Rank | #41 |
| Market Cap | $1.92B (+11.59%) |
| 24h Volume | $235.8M (+15.15%) |
Why Is Polkadot Price Up Today?
Sector rotation into altcoins, as capital flows out of Bitcoin dominance into higher-beta assets, per CoinMarketCap's market data.
DOT is significantly outperforming a modestly positive broader market, and the move is being linked to that rotation amid macro volatility.
The heavy short liquidations shown above suggest leveraged positioning is amplifying the move on top of that underlying flow.
Polkadot News Today: DOT Liquidations Show Shorts Getting Squeezed
| Window | Total Liquidated | Long | Short |
| 12h | $223.77K | $77.24K | $146.53K |
| 24h | $410.15K | $86.65K | $323.51K |
Short positions make up nearly 79% of the 24h liquidations Coinglass data, adding extra fuel to today's rally as short sellers get forced to buy back $DOT.
$DOT Technical Analysis (Channel Breakout Pattern)
DOT is trading at $1.1197 after breaking the channel. What makes this chart worth watching is a repeating pattern of channel breakouts. Over the past month, $DOT has broken out of a falling channel three separate times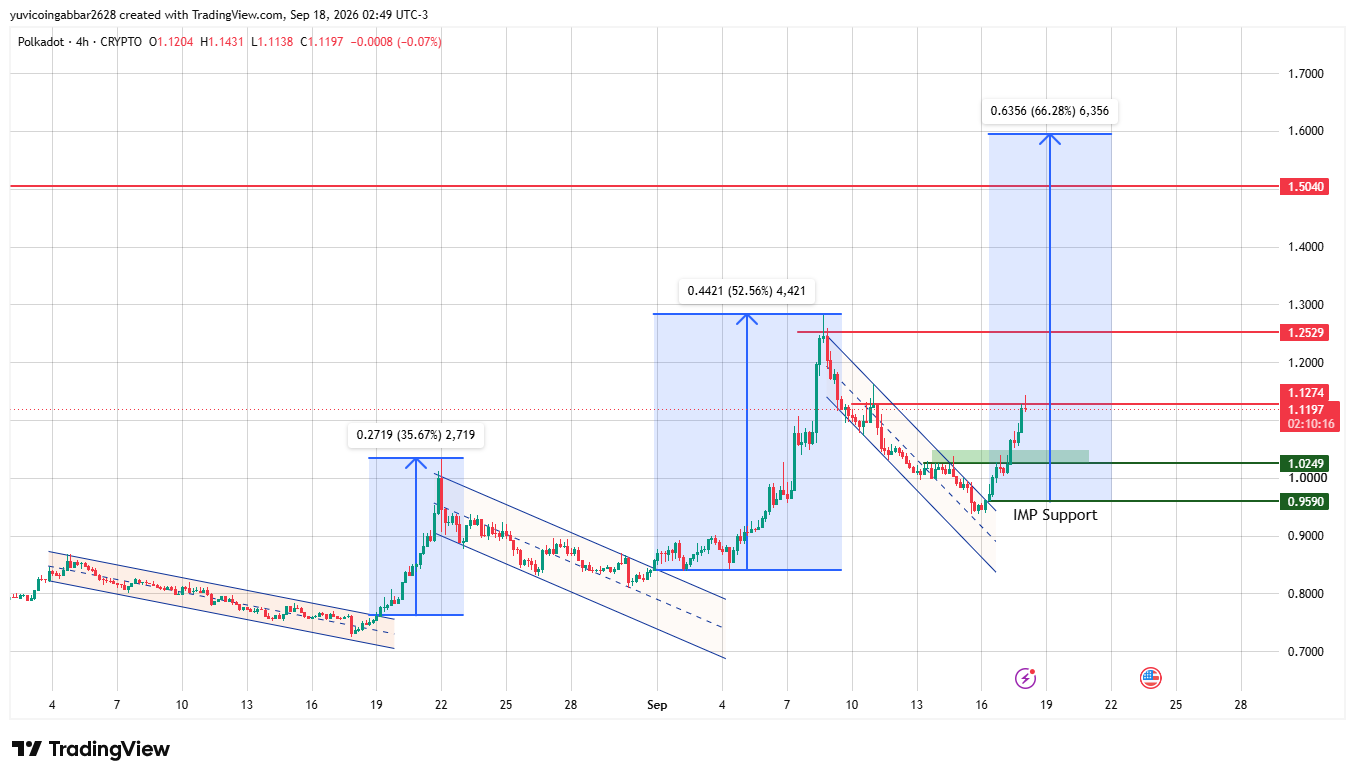
The first breakout produced a 35.67% gain.
-
The second breakout produced a larger 52.56% gain.
-
$DOT has now broken out of a third falling channel and can probably reach this level and gain 66.28% this time.
Currently, around 40% of the range remains. The price broke out of the channel and moved sharply higher, while the range has been expanding by approximately 15% each time.
If that 66.28% move plays out from the recent breakout zone near $1.00 to $1.02, it would put DOT in the $1.65 level. That would also mean clearing both marked resistance levels at $1.2529 and $1.5040 along the way.
This is a repeating pattern, not a guarantee. Each breakout has come from a similar setup: a falling channel, a reclaim of support, and then an expansion move.
That the first two moves actually landed close to their measured targets adds weight to the idea, but a rejection at $1.2529 or $1.5040 would be the first sign of pullback and a continuation.
Polkadot Channel Pattern IMP Key Levels
| Level Type | Price |
| Resistance 2 | $1.5040 |
| Resistance 1 | $1.2529 |
| Current Price | $1.1197 |
| Immediate Resistance (recent high) | $1.1274 |
| IMP Support (upper) | $1.0249 |
| IMP Support (lower) | $0.9590 |
Where Does Polkadot Stand Next? Key $DOT Levels to Watch
Bull case: Holding above the IMP Support zone at $1.0249 and clearing $1.2529 would confirm the channel-breakout pattern is repeating, opening a path toward $1.5040 and potentially the $1.65 to $1.70 projection zone if the third measured move plays out like the first two.
Bear case: A drop back below $1.0249 would put the breakout pattern in doubt, and losing $0.9590 would suggest this move is fading rather than repeating the expansion seen in the prior two breakouts.
Polkadot Price Prediction: Can Polkadot Reach $1.70?
It's possible if the current breakout mirrors the size of the previous two, which is exactly what the chart's measured-move pattern is projecting.
Getting there would require $DOT to clear both $1.2529 and $1.5040 first, and each of those levels could stall momentum along the way.
It's a level worth watching rather than assuming, since past breakouts don't guarantee the next one repeats at the same scale.
Polkadot Price Prediction 2026: Expert View
According to CoinGabbar analysts, The rotation into altcoins and today's short squeeze explain why DOT is moving, but the more interesting story sits on the chart itself.
Two prior channel breakouts landed close to their measured targets, and a third is now forming from the same kind of setup.
$1.2529 is the first real test of whether that pattern holds.
Disclaimer
This article is for informational purposes only and isn't financial advice. Crypto markets are highly volatile, and DOT prices can move sharply in either direction. The analysis and price levels discussed are based on market data and technical patterns and are not guaranteed. Always do your own research and consider your risk tolerance before making any trading or investment decisions involving DOT.


















