Why Polkadot Up Today: Can $DOT Really Hit $10? IMP Breakout!


Polkadot is waking up, and the chart and social media calls are getting bold. One widely shared forecast has $DOT bottoming near $0.75, with $3.50 as the first target, nearly 3.6x from current levels, and next target? back in play if that holds.
This Polkadot price prediction checks the DOT price target 2026 chatter against what the chart actually shows right now.
Market data was checked on September 17, 2026, at 10:21 UTC.
Polkadot Price Prediction Today: Market Overview
Metric | Value |
Price | $1.01563 |
24h Change | +7% |
Market Cap | $1.73B |
Unlocked Mkt Cap | $1.77B |
FDV | $2.13B |
24h Volume | $201.9M |
Vol/Mkt Cap (24h) | 11.64% |
Total Supply | 1.7B |
Max Supply | 2.1B |
Circulating Supply | 1.7B |
Source: Data from CoinMarketCap as of September 17, 2026, at 10:21 IST. Figures may vary slightly across other tracking websites.
Polkadot News
A widely shared chart post argues Polkadot has formed a potential bottom around $0.75, with $3.50 as the first key level, roughly 3.6x from the current price, and a possible run toward $10 if $3.50 gets reclaimed. 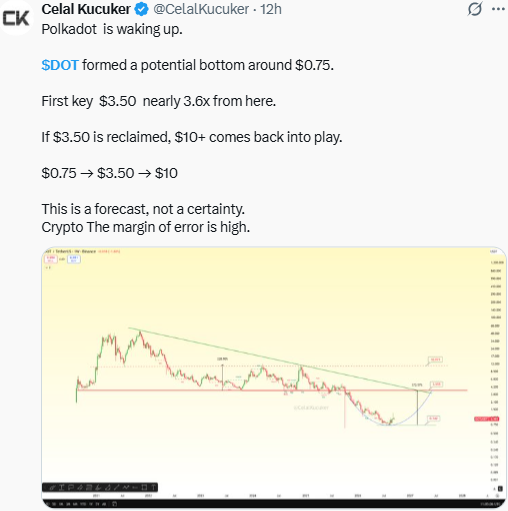
Source: Data From X
Trader Eyes $0.75 → $3.50 → $10 Path
The post itself frames this as a forecast rather than a certainty, adding that the margin of error is high, and CoinGabbar could not independently verify the long-term pattern behind the call.
DOT Technical Analysis: Price Chart and EMA Levels
Pair: DOT/USD · Market: Spot (Crypto) · Timeframe: 4H · Source: TradingView · Timestamp: September 17, 2026, 00:57 UTC-3
DOT is trading at $1.01563, after breaking out of the descending channel, it had been trading in since September 9.
The DOT EMA levels sit just below price, with the EMA 20 at $0.99428 and the EMA 50 at $1.00841, both acting as support after the breakout and for trend continution.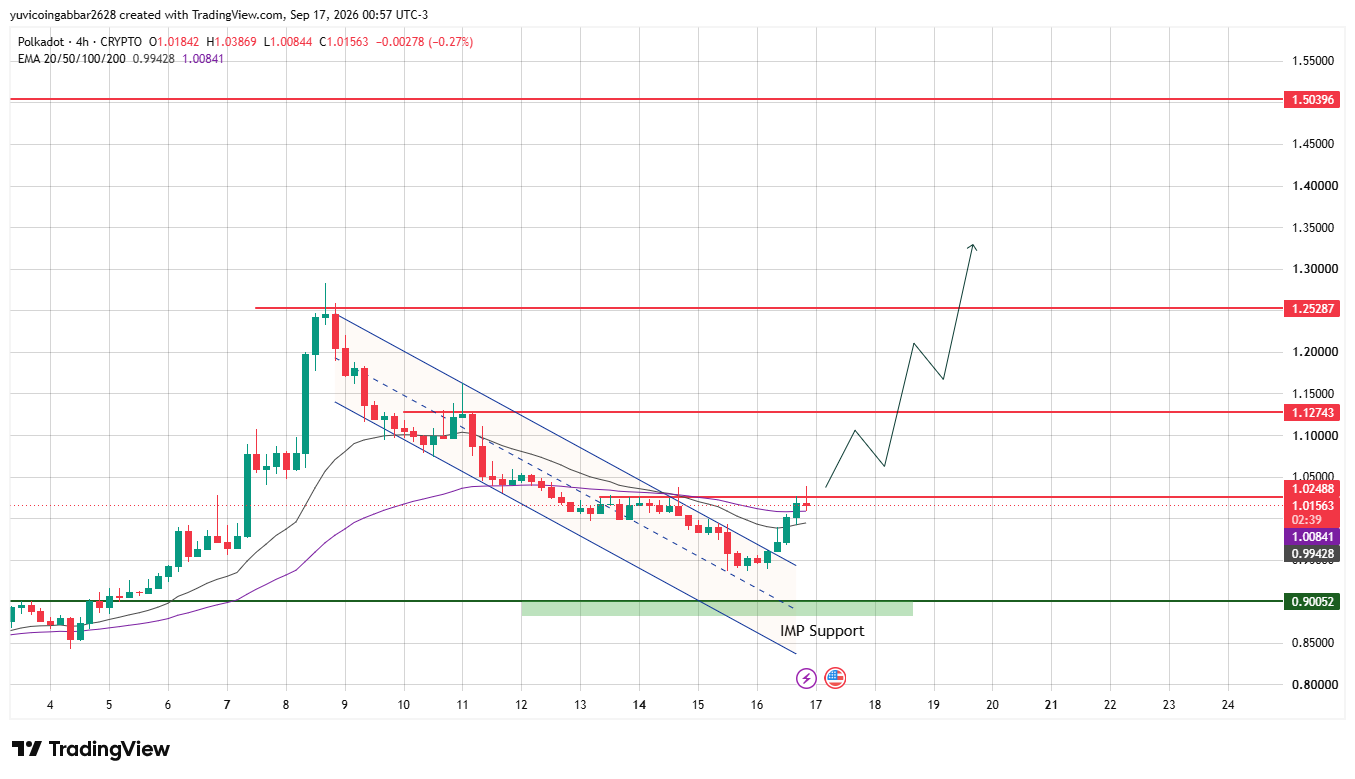
$DOT Support and Resistance Levels: Polkadot Forecast Zones
Level Type | Price |
Resistance 3 | $1.50396 |
Resistance 2 | $1.25287 |
Resistance 1 (nearest) | $1.12743 |
Immediate Price Reference | $1.01563 |
EMA 50 (near support) | $1.00841 |
EMA 20 (near support) | $0.99428 |
Support Zone (IMP Support) | $0.90052 |
Polkadot Forecast: Bull Case vs Bear Case
Bull case: Holding above the EMA cluster at $0.99428 to $1.00841 keeps the channel breakout intact, and clearing $1.12743 would open the path toward $1.25287 and eventually $1.50396.
Bear case: Losing the EMA cluster and slipping back into the old channel would put the breakout in doubt, with the $0.90052 IMP Support zone as the level that needs to hold to keep the wider setup alive.
Polkadot News: Triggers & Invalidation
Scenario | Trigger | Likely Outcome | Invalidation Point |
Breakout hold | Holds above $1.00841 | Push toward $1.12743 | Close below $0.99428 |
Range test | Trades between $0.99 and $1.03 | Consolidation before next leg | Break below $0.90052 |
Breakdown | Loses $0.90052 | Deeper pullback | Structural support lost |
Polkadot Price Prediction: Can $DOT Reach $3.50?
$3.50 sits far beyond every resistance level marked on the current chart, where the highest is $1.50396.
Getting there would need $DOT to clear that level and then more than double again, a move the chart doesn't currently support, even though the breakout above the EMA cluster points in a similar direction.
Polkadot Price Prediction 2026: Expert View
According to CoinGabbar analysts, The breakout above the EMA cluster is a genuinely bullish signal on the short-term chart, but the $3.50 and $10 targets floated on social media sit well outside anything visible here.
The $0.99428 to $1.00841 zone is what actually matters right now, holding it keeps the near-term setup intact regardless of the bigger call.
Disclaimer
This piece is for informational purposes only and isn't financial advice. The levels and scenarios above are based on technical chart analysis and publicly available data at the time of writing, and crypto markets can move sharply within hours, so past patterns don't guarantee future outcomes. It's worth doing independent research and considering your own risk tolerance before acting on any of the levels discussed here.













.jpg)




