Polkadot Short-Term IMP Levels Before New All-Time High?


$DOT just trading below the descending trendline it had been riding down since September 8, even as trading volume surged past $109 million, up nearly 38% in a day.
That's an unusual mix, rising volume on a bearish break rather than a bullish one.
Price is down about 2.5% today near $0.9898. This Polkadot price prediction checks what that volume surge actually means against the chart.
Market data was checked on September 15, 2026, based on the chart timestamped 11:11 (UTC).
Polkadot Price Prediction Today: Market Overview
Metric | Value |
Price | $0.9898 |
Market Cap | $1.68B (-2.48%) |
Unlocked Market Cap | $1.73B |
24h Volume | $129.9M (+37.96%) |
Vol/Mkt Cap (24h) | 7.69% |
FDV | $2.08B |
Total Supply | 1.7B |
Max Supply | 2.1B |
Circulating Supply | 1.7B |
Source: Data from CoinMarketCap as of September 15, 2026, at 11:21 IST. Figures may vary slightly across other tracking websites.
Polkadot Liquidation Data
Window | Total Liquidated | Longs | Shorts |
12h | $221.34K | $196.56K | $24.77K |
24h | $305.09K | $227.68K | $77.41K |
Longs have taken the large majority of liquidations in both windows, consistent with price breaking down through the trendline rather than holding it (data via Coinglass).
Crypto News Today: $DOT Volume 
Source: Data From X
Polkadot News: 24-hour trading volume surpassed $109 million, a notable jump that lines up with the tracker's own reading of volume up nearly 38% on the day.
DOT Price Prediction Chart: Technical Analysis
Pair: DOT/USD · Market: Spot · Timeframe: 4H · Timestamp: September 15, 2026, 02:11 UTC-3
DOT trades at $0.9898, down 2.5% on the candle, trading below the descending trendline that capped its pullback from the September 8 high.
Price is now trading under both EMAs, a short-term bearish signal, with the volume surge suggesting real participation behind the move rather than thin, low-conviction selling.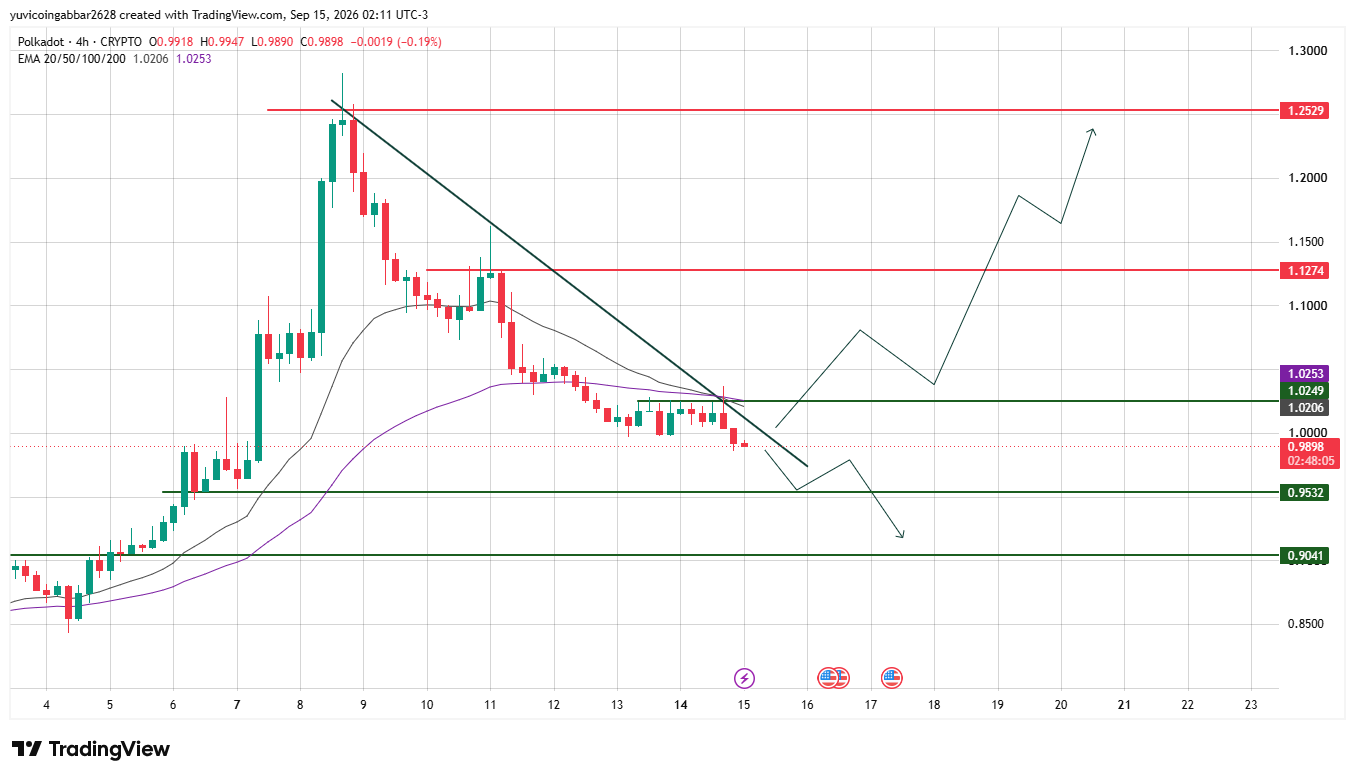
$DOT Key Levels to Watch: Support and Resistance Outlook
Level Type | Price |
Resistance 2 | $1.2529 |
Resistance 1 (nearest) | $1.1274 |
Immediate Price Reference | $0.9898 |
First Confirmed Support | $0.9532 |
Deeper Support | $0.9041 |
Polkadot Forecast: Bull Case vs Bear Case
Bull case: Reclaiming the EMA cluster near $1.0206 to $1.0253, and the trendline above it, opening the path toward $1.1274 and then $1.2529.
Bear case: Holding below the EMA cluster keeps $0.9532 as the next test, with a break there exposing $0.9041. The heavy long liquidations over the past 24 hours support the bearish case for now.
$DOT Triggers and Invalidation
Scenario | Trigger | Likely Outcome | Invalidation Point |
Trendline reclaim | Close above $1.0206 | Push toward $1.1274 | Rejection back below $0.9898 |
Support hold | Bounce from $0.9532 | Range continues under the EMA cluster | Close below $0.9532 |
Support breakdown | Close below $0.9532 | Slide toward $0.9041 | Reclaim of $0.9532 |
Polkadot Price Prediction: Can $DOT Reach $1.2529?
$1.2529 is the highest resistance marked on the chart.
Getting there would require DOT to first reclaim the EMA cluster near $1.0206, then clear $1.1274, a multi-stage recovery rather than a quick bounce.
Polkadot Price Prediction 2026: Expert View
According to CoinGabbar analysts, The trendline on rising volume is dominant right now, and it leans bearish until DOT reclaims the EMA cluster.
The $0.9532 to $1.0206 zone is what matters most over the next few days.
Disclaimer
This piece is for informational purposes only and isn't financial advice. The levels and scenarios above are based on technical chart analysis and publicly available data at the time of writing, and crypto markets can move sharply within hours, so past patterns don't guarantee future outcomes. It's worth doing independent research and considering your own risk tolerance before acting on any of the levels discussed here.











.jpg)






