Aave Price Prediction: $30B Deposits Fuel $AAVE Bullish Momentum


Aave is gaining some traction again due to the return of capital in the decentralized finance space.
New data seen in social media reveals that the total deposits in Aave now stand at $30.16 billion, a rise of 30% from July 1, reflecting better liquidity in the protocol.
One more market update reveals that AAVE broke from an important region and headed towards its recent highs.
In this light, this Aave Price Prediction explores the potential of Aave moving forward based on improved DeFi and liquidity.
Aave Market Overview
Metric | Value |
Change | +15% |
Price | $141.58 |
Market Cap | $2.18B |
24h Volume | $828M+ |
Vol/Market Cap (24h) | 37.79% |
FDV | $2.27B |
Liq/Market Cap | 0.71% |
TVL | $17.82B |
Market Cap/TVL | 0.1229 |
Total Supply | 16M AAVE |
Circulating Supply | 15.42M AAVE |
Source: Data from CoinMarketCap as of August 22, 2026, at 1:48 IST. Figures may vary slightly across other tracking websites.
DeFi Liquidity Is Returning
Source: Data From Twitter
Aave deposits have risen to $30.16 billion, showing a 30% increase from July 1.
This dramatic increase in deposits means that more liquidity is being generated in Aave and increased activity in the DeFi industry, backing the overall bullish trend on AAVE.
AAVE Price Prediction: Long-Term Chart Analysis

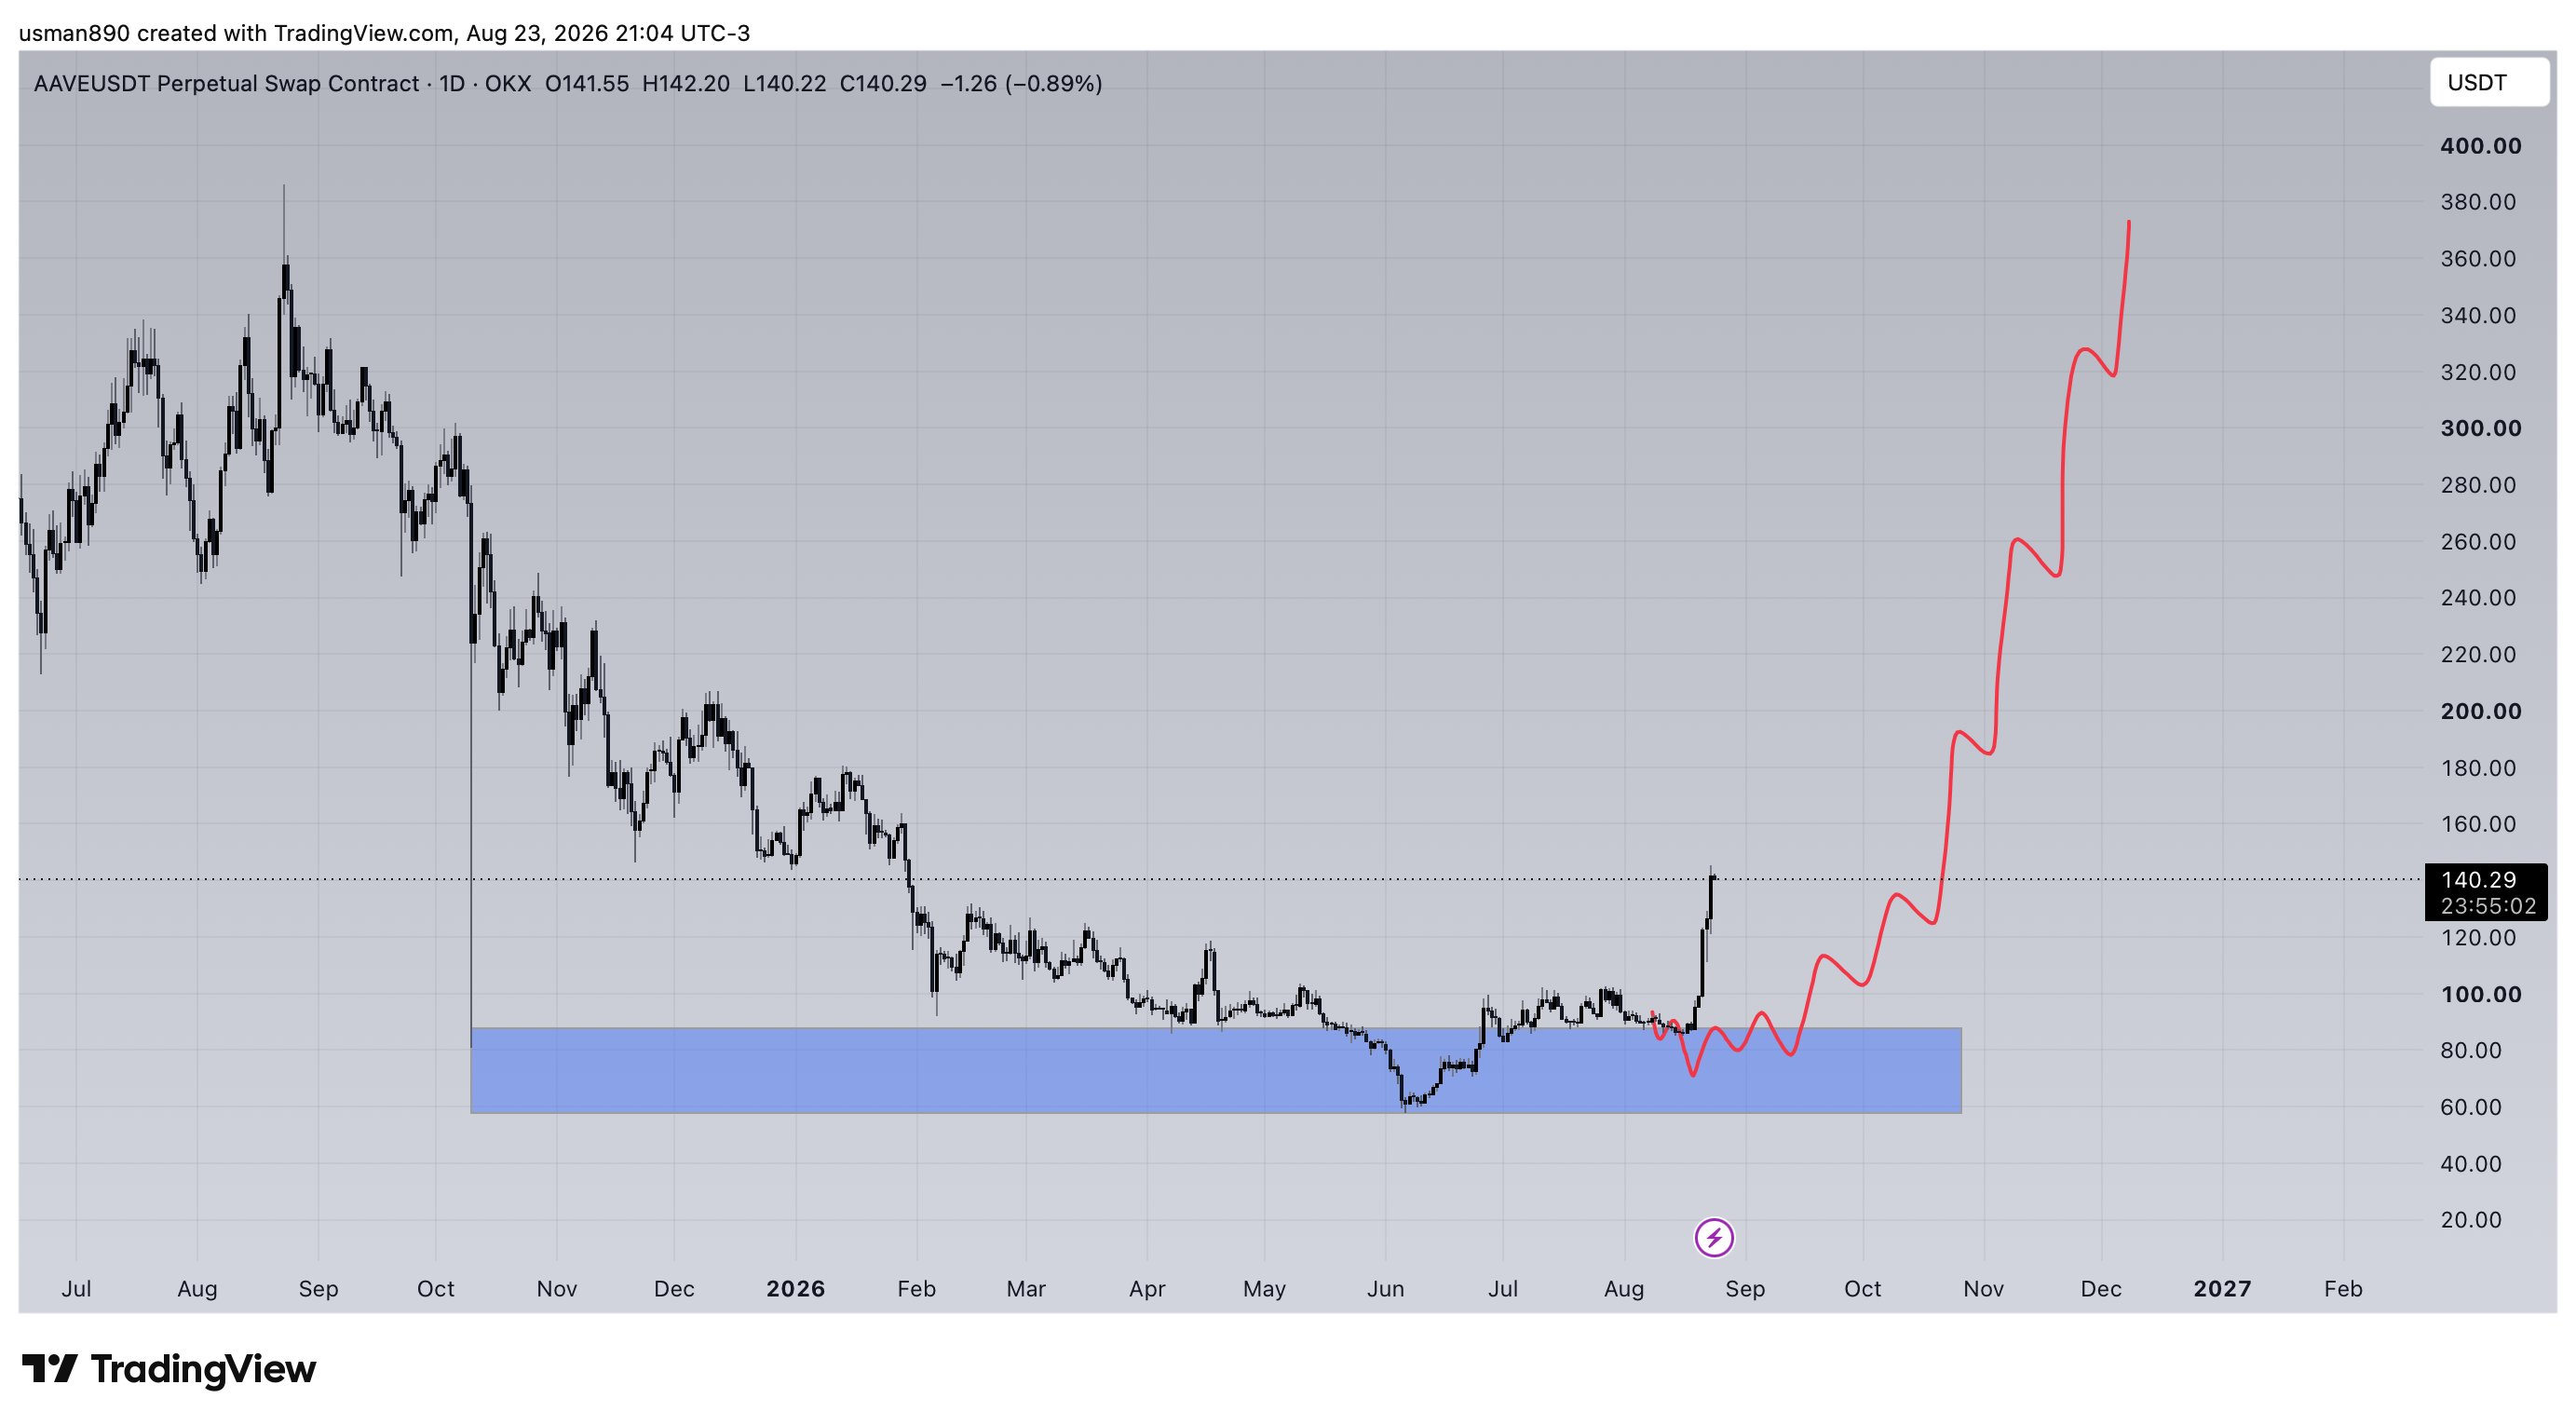
Source: Data From X
AAVE has been exhibiting strong rebounds from the designated support area and rising towards the previous highs.
$AAVE Price Prediction: Chart Analysis
The AAVE is currently trading near $141.58 on the daily chart following a strong bullish trend.
The price has risen significantly above the range seen in the previous trading structure, indicating a strong buy pressure.
The chart clearly indicates an expansion from the lower price range of around $90 to the current price range of around $140.
Following a breakout of the previous resistance range, the price rallied slightly above $140 before falling back to the current price range.
The immediate concern would be the ability of buyers to maintain the price above the $135.86 support range.
Maintaining this range would preserve the current bull trend structure, and it could allow the $AAVE price to break out of the higher resistance ranges as shown on the chart.
A secondary support range lies at $121.23.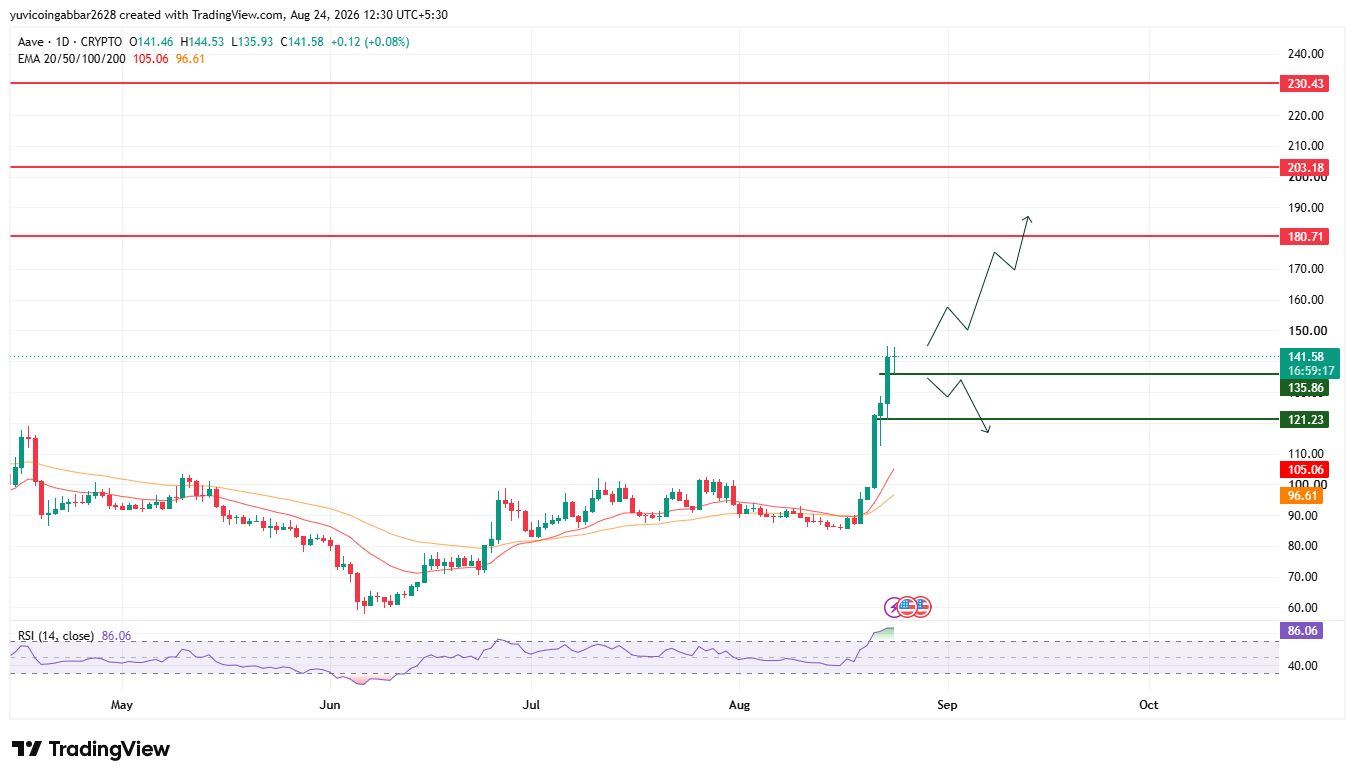
Key $AAVE Price Levels to Watch
Level Type | Price |
Major Resistance 3 | $230.43 |
Major Resistance 2 | $203.18 |
Major Resistance 1 | $180.71 |
Current Price | $141.58 |
First Support | $135.86 |
Deeper Support | $121.23 |
EMA 20 | $105.06 |
EMA 50 | $96.61 |
$AAVE price target 2026: Bull Case
The bullish case is valid so long as $AAVE is able to defend $135.86.
If buyers continue holding this support and price starts building liquidity around the current zone, the market could regain momentum toward $180.71.
A confirmed move through that resistance would strengthen the broader bullish structure and bring $203.18 into focus.
If buying pressure remains strong beyond that level, $230.43 becomes the next major chart target.
$AAVE price target 2026: Bull Case
The bull case will be invalidated in case it breaks down below the $135.86 level.
A break below the $135.86 support level could pave the way for a retest towards the $121.23 level.
This would not necessarily destroy the longer-term recovery structure, but it would indicate that buyers need more time to rebuild momentum.
If $121.23 also fails, the next important area would be around the EMA zone near $105.06 to $96.61.
Expert Analysis: What's Next for $AAVE?
According to CoinGabbar analysts, the $AAVE price is now at a crucial level following its strong upward run. The immediate fight will be in the range between $135.86 to $141.58, where buyers must hold.
A move above $135.86 could give the bulls time to consolidate and make another push for $180.71. A clean breakout above $180.71 could strengthen the bulls' position while taking their sights on $203.18 and ultimately $230.43.
However, a move below $135.86 could see it falling towards $121.23 before bulls make another attempt at recapturing the losses.
For now, the technical view for the asset is still very positive, although the very high RSI means that any further moves have more risks involved. The most important thing will be whether it can hold its highly valued price structure or not.
Disclaimer: This piece is for informational purposes only and isn't financial advice. The levels and scenarios above are based on technical chart analysis and publicly available data at the time of writing, and crypto markets can move sharply within hours, so past patterns don't guarantee future outcomes. It's worth doing independent research and considering your own risk tolerance before acting on any of the levels discussed here.
Also read:












.webp)




