Cardano Price Prediction: Can ADA give another breakout of 0.3280?


Cardano is a public blockchain platform that uses an energy-efficient proof-of-stake system. It runs smart contracts and decentralized apps. Its native cryptocurrency is called ADA.
Cardano price prediction is heating up as ADA traders brace for a move that could surprise the market.
Cardano Price Right Now: Live Data and Key Levels
Metric | Value |
CMP (Current Market Price) | $0.2202 |
24-Hour Change | +1.48% |
Market Cap | $8.05 billion |
Futures Volume (24h) | $675.14 million |
Spot Volume (24h) | $134.62 million |
Open Interest | $522.89 million |
Circulating Supply | 36.69 billion ADA |
Total Supply | 44.79 billion ADA |
Max Supply | 45.00 billion ADA |
At the time of the snapshot, Cardano's CMP is $0.2202, while the CoinGlass data panel shows futures volume of $675.14 million, spot volume of $134.62 million, and open interest of $522.89 million.
Methodology Behind This Cardano Price Prediction Today
This ADA price prediction is based on the 1-hour ADA/USDT perpetual chart on Binance, viewed through TradingView.
The CMP is taken directly from the price shown on the chart, while the resistance and support levels are taken from the old swing high and lows marked on the same chart.
The key trendline structure is also based on the repeated rejection points visible on the 1-hour setup.
The main levels currently marked on the chart are $0.2590, $0.2885, $0.3280, $0.2063, and $0.1994.
ADA Liquidation Data Today
The liquidation data shows that the long side has taken more damage across the recent timeframes.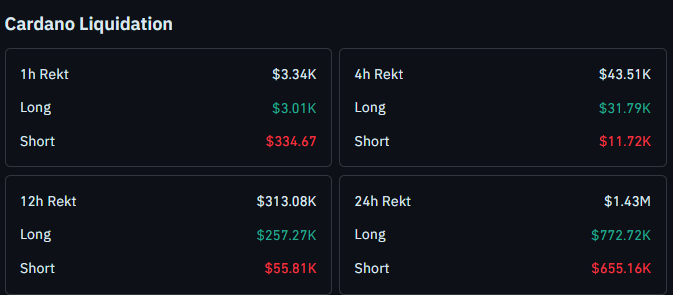
In the past hour, total Cardano liquidations were around $3.34K, with $3.01K in long liquidations compared with $334.67 in short liquidations.
Over the 4h period, total liquidations reached $43.51K, including $31.79K in longs and $11.72K in shorts.
The 12h data shows a much larger figure, with $313.08K in total liquidations. Long liquidations accounted for $257.27K, while shorts accounted for $55.81K.
Across 24h , Cardano recorded around $1.43 million in total liquidations, with $772.72K from longs and $655.16K from shorts.
The recent liquidation data therefore shows that long positions have absorbed more pressure, especially over the 1h, 4h, and 12h windows.
CoinGlass live market data, August 24, 2026, 12:22 IST.
Cardano Holder Concentration Shows Heavy Whale Control
The holder data also shows a highly concentrated ADA supply structure.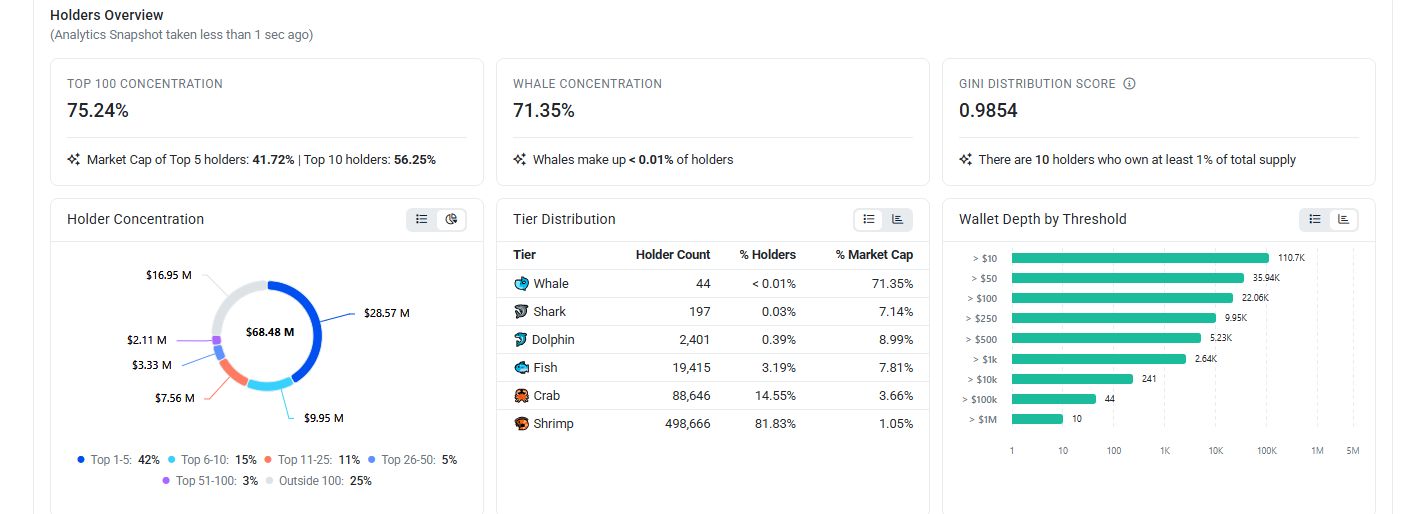
The top 100 holders control 75.24% of the supply, while whale concentration stands at 71.35%.
The data also shows that whales account for less than 0.01% of holders, meaning a very small number of wallets control a large portion of the tracked supply.
The top 10 holders account for 56.25%, while the top 5 holders represent 41.72%.
This concentration is important to watch because large holders can have a meaningful impact on price when ADA approaches major resistance or support levels.
Cardano Price Prediction: 1-Hour Chart Analysis
The 1h chart shows ADA trading beneath a descending trendline after another rejection.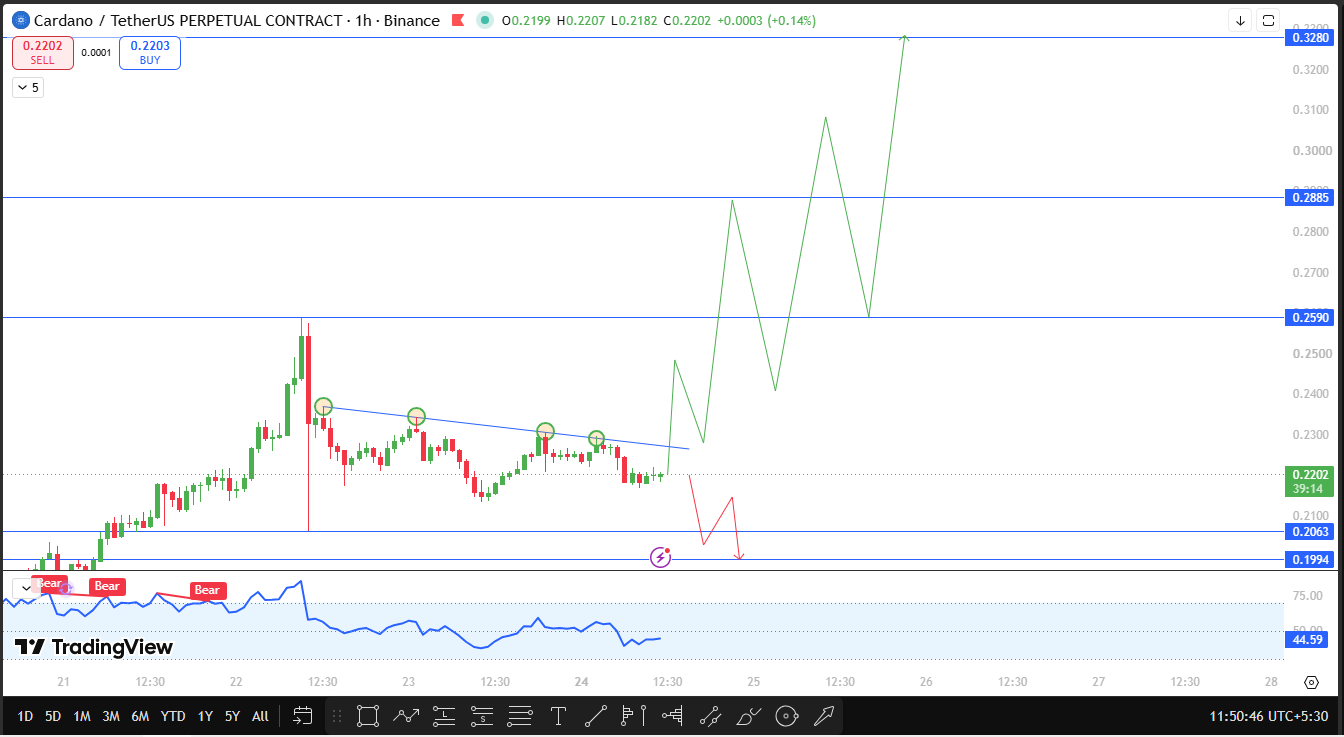
The key part of the setup is the repeated testing of this trendline. The second retest did not trigger the same aggressive selling seen previously, suggesting that sellers were initially losing some momentum.
However, the third retest brought stronger selling pressure and pushed ADA back down from the trendline.
The CMP is $0.2202, while the RSI shown on the chart is around 44.59.
This keeps momentum below the midpoint, meaning bulls have not yet gained enough strength to confirm a trendline breakout.
If ADA breaks and closes above $0.2590, the next resistance on the chart is $0.2885.
If the price clears $0.2885, the next major resistance marked on the chart is $0.3280.
On the downside, a break and close below $0.2063 would weaken the current structure further and bring the next support at $0.1994 into focus.
Technical Outlook Snapshot for This Cardano Price Prediction
Indicator | Signal |
Chart Pattern | 1-hour descending trendline with repeated rejection |
Trendline Retests | The second retest had weaker selling, and the third retest saw stronger selling. |
RSI | Around 44.59 |
Current Price | $0.2202 |
Bullish Trigger | 1-hour close above $0.2590 |
Bearish Trigger | Close below $0.2063 |
Cardano Support and Resistance Levels Worth Watching Now
Level Type | Price | Note |
Resistance 2 | $0.3280 | Major resistance marked on the chart |
Resistance 1 | $0.2885 | Next resistance after the $0.2590 breakout |
Breakout Trigger | $0.2590 | Key level for bullish confirmation |
Current Price | $0.2202 | CMP shown on the 1-hour chart |
Support 1 | $0.2063 | Key downside trigger |
Support 2 | $0.1994 | Next support after the $0.2063 breakdown |
Cardano Price Prediction: Bull Case vs Bear Case
Case | Trigger | Target |
Bull Case | 1-hour close above $0.2590 | $0.2885, then $0.3280 |
Bear Case | 1-hour close below $0.2063 | $0.1994 |
Current Setup | Price remains below the descending trendline. | Watch $0.2590 and $0.2063. |
Invalidation Level for This Cardano Price Forecast
The short-term bullish setup becomes more difficult to defend if ADA loses $0.2063.
A break and close below this level would confirm that sellers are gaining control again and could open the way toward the next support at $0.1994.
Until that happens, the main upside trigger remains the $0.2590 resistance level.
Cardano Technical Analyst View on ADA Price Action
Bull Case: If it breaks the descending trendline and closes above $0.2590, the next resistance levels are $0.2885 and $0.3280. A sustained move above these levels would show that buyers have finally overcome the repeated trendline rejection.
Base Case: ADA continues moving below the descending trendline and remains caught between $0.2063 and $0.2590. The weaker selling seen on the second retest is encouraging, but the stronger selling on the third retest shows that sellers are still defending the trendline.
Bear Case: If it breaks and closes below $0.2063, the next support to watch is $0.1994. A loss of this level would put additional pressure on the short-term structure.
Disclaimer
This article is for informational purposes only and should not be treated as financial advice. Cryptocurrency markets are highly volatile, and readers should do their own research before making any investment decisions. The levels discussed above are based on the supplied 1-hour chart and data snapshots and are not guaranteed outcomes.












.webp)




