Avalanche Price Prediction: Will AVAX Bounce or Break Down?


$AVAX is telling two different stories right now, depending on which chart you look at.
On the daily timeframe, Avalanche just broke below the ascending trendline that carried it higher through June and July, flipping the near-term structure bearish.
On the 4-hr chart, though, price broke out of a shorter descending channel and is holding above it, the kind of setup that usually points the other way.
That contradiction is the real question behind this Avalanche Price Prediction: is the 4-hr recovery strong enough to change the daily picture, or is it just a bounce inside a bigger downtrend?
Why Is AVAX Under Pressure Right Now?
AVAX is trading around $6.39, down 3.13% over the past 24 hr and down.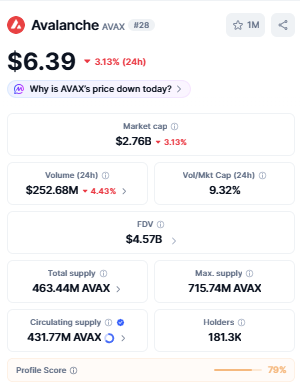
The move lower lines up with broader risk-off pressure across altcoins, and Avalanche looks especially exposed given how far open interest has already retreated from last year's highs.
Sentiment is cautious rather than panicked, and traders are watching the graph, not a single headline, to decide what comes next.
Data source: CoinMarketCap
Are AVAX Traders Leaning Long Into the Dip?
Open interest sits at $256.60M, a fraction of the roughly $1.8B seen at last October's peak; most of the speculative excess has already been wrung out of this market.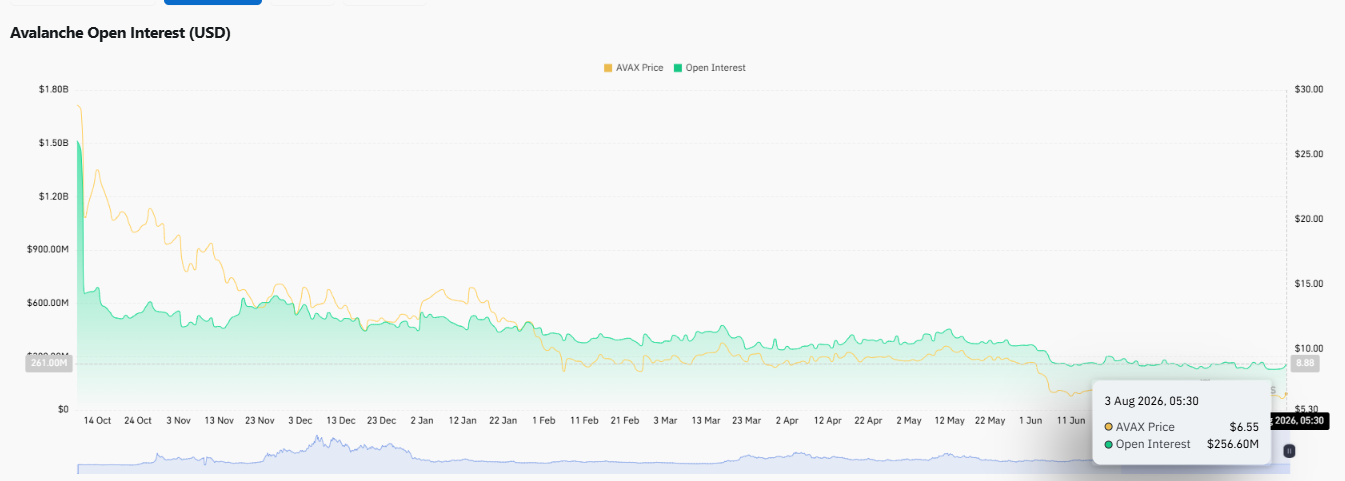
Positioning looks lopsided given the price action. Binance's AVAX/USDT account ratio is 2.0836, and OKX's is 1.65, both firmly long. Binance's top traders are even more heavily long, running a 2.5562 account ratio and a 1.5793 position ratio, a market leaning long into a falling price.
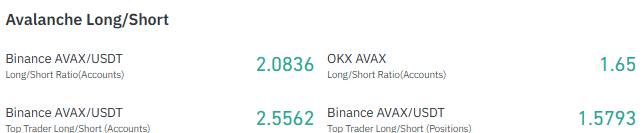
Which usually means either conviction at the bottom is near or a long base that keeps getting tested is. Liquidations are back on the second read.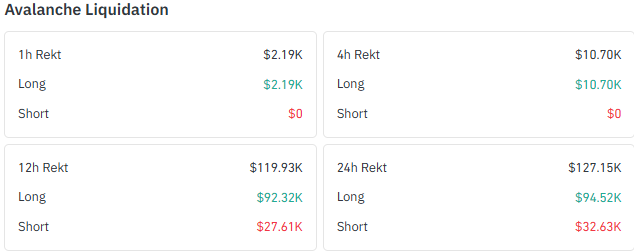
Over the past 24 hours, $127.15K was liquidated, and $94.52K of that came from longs, with the 12-hr and 4-hr windows showing the same pattern. Heavy long positioning hasn't paid off yet.
What Does the Broader Price Action Say?
The pullback isn't limited to the past day. AVAX is down 7.81% over 30 days, 30.17% over 90 days, and 35.29% over 180 days.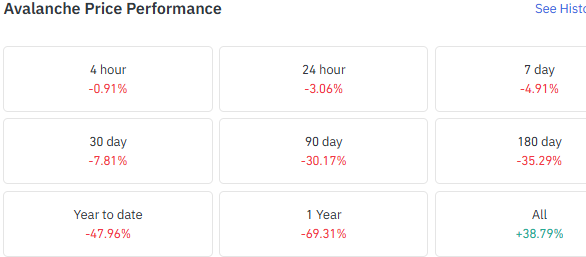
Zoom out to a full year, and Avalanche is down 69.31%, even with the token still up 38.79% since its earliest tracked levels, a reminder of how much this crypto market outlook has cooled since AVAX's early run.
Data source: coinglass
Daily and 4-Hour Chart: Two Timeframes, One Unresolved Setup
On the 4-hour chart, AVAX broke out of a descending channel and is still holding above it, though price pulled back after testing resistance at $6.68. RSI sits at 46.80, still searching for direction.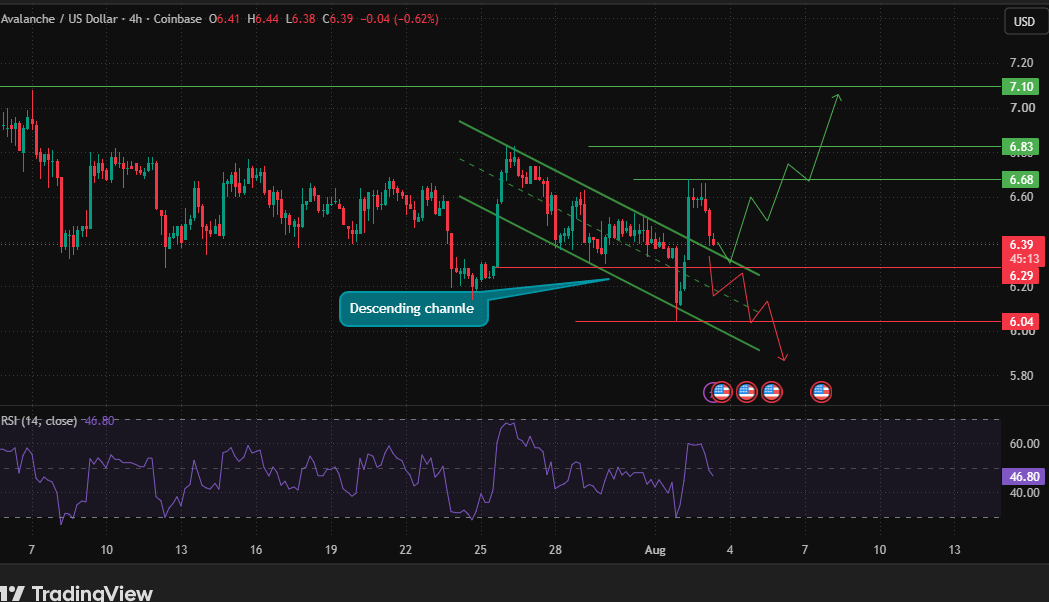
Holding the channel keeps $6.83 and $7.10 in view; losing it shifts focus to $6.29, then $6.04.
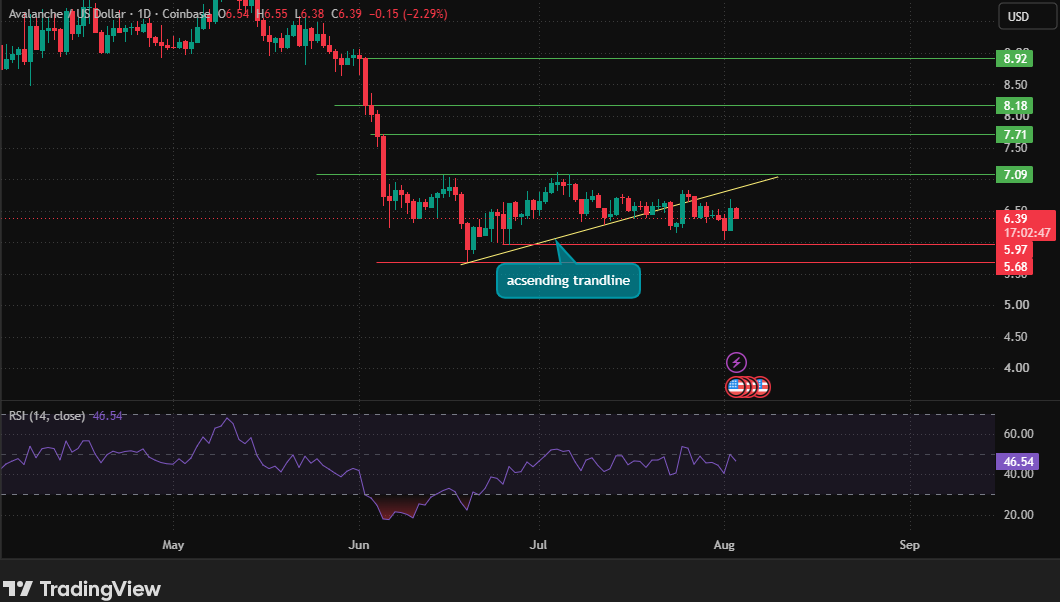
On the daily time frame, AVAX broke below the ascending trendline that carried it from June's lows up to resistance at $7.09, and price now trades around $6.39.
RSI reads 46.54, weak but not broken down entirely. $5.97 is the support that matters most; below it, $5.68 is next. Reclaiming $7.09 would reopen $7.71, $8.18, and $8.92 above. This is where AVAX technical analysis carries more weight than either timeframe on its own.
Data source: TradingView
Where Does That Leave AVAX's Sentiment?
The 4-hr recovery attempt is a genuine short-term positive, but the daily time frame broken trendline is the higher-timeframe signal, and it hasn't been reclaimed.
Until AVAX clears $7.09 on the daily time frame, the bigger picture stays cautious.
Avalanche Price Prediction: Three Scenarios for AVAX
Scenario | Trigger | Price Outlook |
Bullish | AVAX holds $5.97 on the daily chart and reclaims $7.09, the level that broke down in July. | Opens a path toward $7.71 and $8.18, with $8.92 the highest marked level; a 4-hour push through $6.83 and $7.10 leads the way there. |
Base Case | AVAX consolidates between $5.97 and $7.09 on the daily chart while the 4-hour range oscillates between $6.29 and $6.68. | Still testing whether the channel breakout holds as support, the likeliest scenario is that both timeframes stay unresolved. |
Bearish | AVAX breaks below $5.97 on the daily chart, with the 4-hour chart losing $6.29. | Opens the door to $5.68 and risks a new low beyond current marked support; a break of $6.29 followed by $6.04 would confirm the recovery attempt has failed. |
Two Timeframes, One Unresolved Question
AVAX's 4-hour chart is trying to build a recovery inside a daily time frame that just broke down. Both things are true at once, and that tension is the real state of this market right now, not a single clean signal.
$7.09 on the daily time frame and $6.83/$7.10 on the 4-hour chart are the levels that would tilt this bullish.
$5.97 on the daily and $6.29 on the 4-hour would tilt it bearish. Until one side wins, AVAX stays in a wait-and-see position.
Disclaimer: This analysis is for informational purposes only and does not constitute financial advice. Cryptocurrency markets are volatile, and readers should conduct their own research before making investment decisions.
1 month ago
FROM CRAB FISHERMAN TO $64 MILLION LOTTO WINNER WITH LORD BUBUZA SPELL: I have been a crab fisherman for 40 years. I started working at a local fish plant a few years ago. I love playing lotto bets, so I buy lotto tickets often but find it difficult to win. I read about Lord Bubuza's lottery spells on the internet, so I contacted him for help to win Lotto 649. He told me that he would need to cast a lotto spell so that he can reveal the lotto numbers I will choose. I was sceptical, but my wife Nancy told me to give it a try. I provided his requirements to cast the lotto spells, and he gave me the numbers. I bought a Lotto 649 ticket and played as Lord Bubuza instructed, to my surprise it was a big win. I won $64,000,000. My partner Nancy and I travelled to the Atlantic Lottery in Moncton to confirm the win and collect the prize. I will retire from my crab fishing with this win and continue to recommend lord Bubuza. Join me and appreciate Lord Bubuza for his help via Email: lordbubuzamiraclework@hotmail.com or WhatsApp: +1 (365) 808 5313

1 month ago
I have had my own share of binary option scam, I lost over 22k USD, and i was still told to send more money to unlock my account. I reached out to recoverydarek@gmail.com and they helped me get my money back. If you have ever been scammed or you know someone that has been scammed, recoverydarek@gmail.com will get the money back. They are a recovery team that specialize in ful nds recovery, be it cryptocurrency , bitcoin, forex, catfish/romance scam. They are very real.


















