Best Wallet Price Prediction: Trapped Before a Big Move? Buyers Watch!


By Crypto Markets Analyst. Reviewed by the Crypto Markets Editor. Chart and market figures below reflect a snapshot taken on July 31, 2026. BEST currently shows zero recorded 24-hour volume, so treat any single-day read with caution and verify live numbers before acting.
Start with the chart, since that is the clearest signal on the table right now: Best Wallet Price Prediction has spent since May compressing into a symmetrical triangle, price swinging between a falling upper trendline and a rising lower one, now converging almost to a point.
Triangles like this do not resolve gently; they break, and which direction they break tends to define the next several weeks far more than any single news headline would.
Best-Wallet Token Price Today: Live Data and 24-Hour Change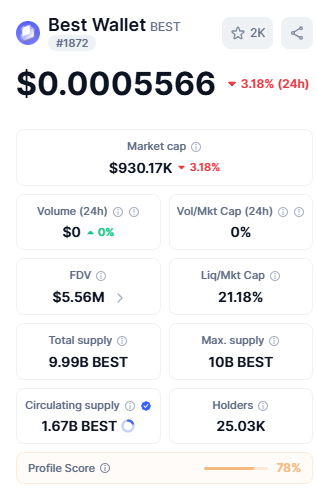
Source: Best Wallet info by CoinMarketCap, captured July 31, 2026
$BEST trades at $0.0005566, down 3.18% on the day, with a $930.17K market cap calculated against its 1.67 billion circulating supply.
That's a meaningfully smaller number than the $5.56M FDV, calculated against the full 9.99 billion total supply, a gap worth sitting with: roughly 8.32 billion $BEST, about 83% of eventual supply, is not circulating yet.
Reported 24-hour volume shows $0, which limits confidence in today's exact percentage move, though the tracker's Profile Score of 78% suggests the underlying data quality and liquidity depth (21.18% of market cap) are reasonably solid compared to smaller, thinner-traded presale tokens.
Best-Wallet Price Prediction for August: Bull, Base and Bear Cases
Scenario | Trigger | Price Range |
Bear | Triangle breaks down through $0.0003616. | $0.0001052 - $0.0003616 |
Base | The triangle continues compressing; no confirmed break. | $0.0004500 - $0.0007000 |
Bull | Triangle breaks up through $0.0009858. | $0.0009858 - $0.001185 |
The base case simply describes what's already happening: indecision inside a shrinking range.
Invalidation: the bull case fails on any daily close back below $0.0007. The bear case fails if BEST reclaims and holds above $0.0007 for more than two consecutive sessions.
Best Wallet Technical Analysis: Key Support and Resistance Levels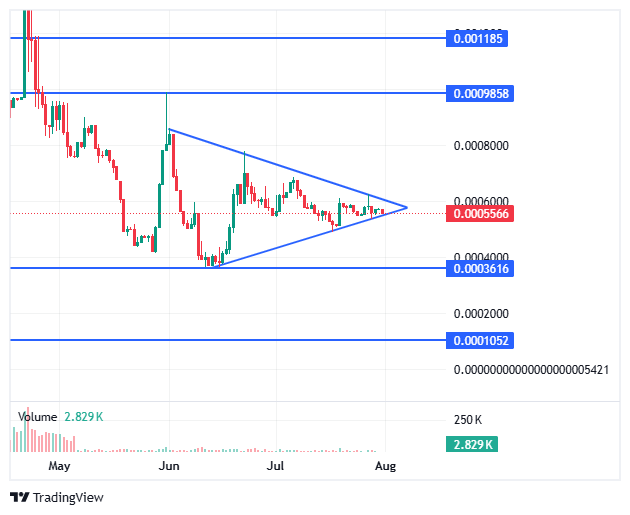
Source: Best-Wallet Trading Chart by CoinMarketCap, captured July 31, 2026
The exact levels drawn on the chart matched precisely against the current setup: an upper resistance ceiling at $0.001185, with a closer first resistance at $0.0009858 just below it.
On the downside, the immediate support sits at $0.0003616, and beneath that, a secondary Fibonacci-based support rests at $0.0001052, a level that also happens to sit close to BEST's post-launch trading floor.
Price currently sits at $0.0005566, almost exactly at the triangle's midpoint, which is precisely why a clean break in either direction, not a slow drift, is the more likely resolution pattern here.
Per the reading shared alongside this data: a confirmed break below $0.0003616 opens the path toward the $0.0001052 Fibonacci support, and a failure to hold that level would put $BEST into new all-time-low territory.
A confirmed break above the triangle's upper boundary instead opens the path toward the $0.0009858 and $0.001185 resistance zones in sequence.
Best-Wallet On-Chain and Fundamental Drivers
Unlike many presale-stage tokens covered this month, Best-Wallet has a genuinely functioning product behind it: a non-custodial, multi-chain wallet app with over a million downloads and support for 1,000-plus cryptocurrencies.
An integrated DEX aggregator across 330-plus exchanges and a built-in "Upcoming Tokens" presale launchpad, real utility rather than a speculative narrative alone.
That context matters because BEST's price collapse has not come from an abandoned or non-functional project; it's come from post-launch supply and demand imbalance.
$BEST raised $17.6M-$18.2M in presale at a final price near $0.026, listed on KuCoin, MEXC, and Uniswap in late November 2025, and traded as low as $0.011 within hours of listing, already a steep drop from presale.
From there, today's $0.0005566 represents a further decline of roughly 95% from that first-day price and about 98% from the original presale entry point.
August 2026 Catalysts That Could Move $Best Wallet Token
No confirmed named catalyst sits on the calendar this month specifically for $BEST.
The more relevant ongoing driver is the wallet app's own user growth and feature rollout, since token utility (fee discounts, staking yield, presale-access priority) is tied directly to active app usage rather than a single scheduled event.
Watch for any official update on app download milestones or new presale-launchpad listings within Best Wallet itself as the closest thing to a real August signal.
Best-Wallet: What Analysts Are Forecasting
Pre-launch forecasts from late 2025 projected it is reaching $0.05 to $0.13 by end of 2026 under bullish adoption assumptions.
Those targets were built on the $0.026 presale price as a baseline and predate the roughly 98% decline that followed; repeating them now without that context would be materially misleading.
Any current Best-Wallet Token Price Prediction needs to start from today's $0.0005566, not from 2025 marketing-era projections.
Best-Wallet Token Long-Term Outlook: 2027 to 2030
A grounded base case assumes it stabilizes and grows modestly alongside continued app adoption, supporting a $0.001-$0.003 range by 2030.
A bull case, requiring the wallet to meaningfully expand its stated ambition toward capturing global wallet market share, could support $0.005-$0.02, still far below original presale-era projections, reflecting how much value has already been lost to post-launch dilution and selling.
Risks That Could Invalidate This Forecast
The largest structural risk is the 8.32 billion it still outside the circulating supply; as more of that unlocks, it adds sustained sell pressure regardless of app adoption trends.
A second risk is the triangle pattern itself resolving downward, which the chart currently shows as a live possibility, not a remote one.
A third is reputational: a token that's fallen roughly 98% from presale tends to face persistent skepticism even if the underlying product keeps improving.
How to Buy and Store $Best Wallet Token Safely
BEST trades on KuCoin, MEXC, and Uniswap; verify listings directly through these platforms rather than third-party links.
Given Best Wallet is itself a wallet app, many holders store it natively within it, though moving significant holdings to cold storage remains standard practice for reducing platform-specific risk.
Glossary
Symmetrical Triangle: A chart pattern of converging trendlines signaling reduced volatility before a breakout in either direction.
Fibonacci Support: A support level derived from Fibonacci retracement ratios applied to a prior price swing.
Circulating vs. Total Supply: The tokens currently tradable versus the full eventual supply; BEST's gap here is roughly 83%.
Disclaimer
Informational purposes only, not financial advice. BEST has declined roughly 98% from its 2025 presale price; all forecasts are estimates, not guarantees. Reported 24-hour volume shows $0, limiting confidence in daily price reads. Cryptocurrency carries significant risk of loss. Verify all data independently before acting.











.jpg)






