Bitcoin Cash Price Prediction: $BCH Builders Buzz, Ready for Rally?


Bitcoin Cash's official account is spotlighting its latest Builders Meetup, with the community rallying around better products, stronger marketing, and everyday adoption.
Bitcoin Cash is a peer-to-peer electronic cash system forked from Bitcoin, built for fast and low-cost payments, according to its own project materials.
This Bitcoin Cash Price Prediction looks at whether $BCH can hold its long-term ascending channel and build toward a rally over the next two to three weeks, a case that would be invalidated by a confirmed close below $188.09.
Here's what the charts say next.
Bitcoin Cash Price Prediction Today: Market Overview
Metric | Value |
Price | $210.92 |
24h Change | +0.45% |
Market Cap | $4.22B (−1.82%) |
24h Volume | $99.42M (−1.07%) |
Vol/Mkt Cap (24h) | 2.37% |
FDV | $4.42B |
Total Supply | 20.06M BCH |
Max Supply | 21M $BCH |
Circulating Supply | 20.06M $BCH |
Total Holders | 37.34K |
Source: Data from CoinMarketCap as of 1/08/2026. Figures may vary slightly across other tracking websites.
Bitcoin Cash News: BCH Builders Meetup: What's Buzzing
Bitcoin Cash's official account recently shared a recap of its "Builders Meetup v4," bringing together developers and community members to focus on better products, stronger marketing, and everyday BCH adoption. 
It's a community and development update rather than a specific price catalyst, so it's worth noting as sentiment context without treating it as something that should move price on its own.
BCH Prediction Chart: Short-Term Technical Analysis
Pair: $BCH/USDC · Market: Spot (Crypto) · Exchange: Coinbase · Timeframe: 4H · Timestamp: August 1, 2026, 12:08 UTC+5:30
$BCH trades at $210.92, well off its early-July high near $248 and chopping in a lower range since.
The EMA 20 ($211.65) and EMA 50 ($213.32)—EMA (exponential moving average) readings that weight recent candles more heavily than a simple average both sit just above the current price, unreclaimed.
RSI (14)—the Relative Strength Index, a momentum gauge reading above 70 as overbought and below 30 as oversold sits at a neutral 47.90.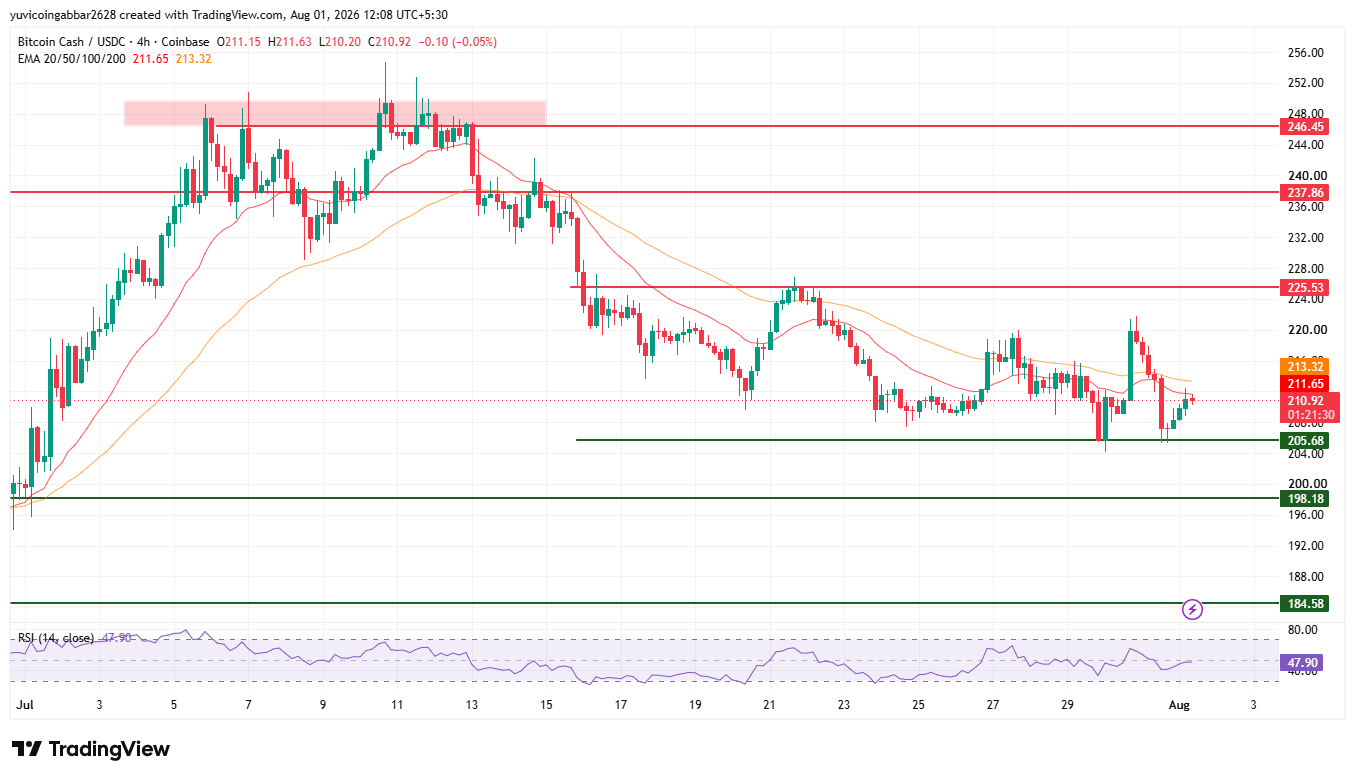
Level Type (Short-Term, 4H) | Price |
Resistance 3 | $246.45 |
Resistance 2 | $237.86 |
Resistance 1 | $225.53 |
Immediate Price Reference | $210.92 |
Support 1 | $205.68 |
Support 2 | $198.18 |
Support 3 | $184.58 |
BCH Prediction Chart: Long-Term Technical Analysis
Pair: BCH/USDC · Market: Spot (Crypto) · Exchange: Coinbase · Timeframe: 1D · Timestamp: August 1, 2026, 12:10 UTC+5:30
Zooming out, BCH is inside an ascending channel that's been forming since the June low, and the price is currently testing the lower boundary of that channel
The EMA 20 ($216.93) and EMA 50 ($233.51) both sit above the current price, unreclaimed. RSI (14) reads a softer 42.85 on the daily.
If the price breaks the channel in either direction, then the key levels are to watch.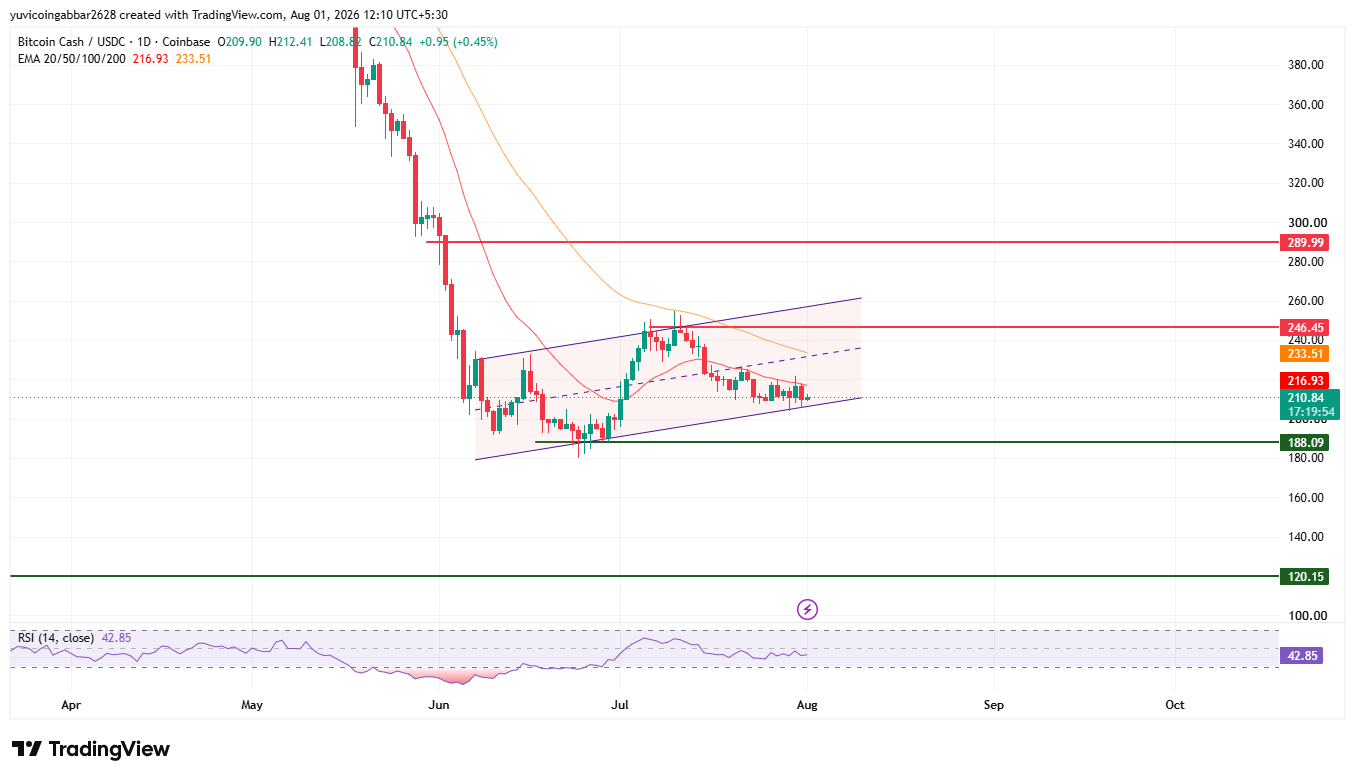
Level Type (Long-Term, 1D) | Price |
Resistance 2 | $289.99 |
Resistance 1 (channel upper boundary / EMA zone) | $246.45 |
Support 1 (channel lower boundary) | $188.09 |
Support 2 | $150.15 |
Bitcoin Cash Forecast: Bull Case vs. Bear Case
Bull case: A reclaim of the EMA 20/50 cluster ($211.65/$213.32) opens $225.53, then $237.86, then the $246.45 channel resistance zone a break above that would target $289.99.
Bear case: A break below $205.68 opens $198.18 and $184.58 on the short-term chart. More importantly, a confirmed close below the channel floor at $188.09 would signal a bigger structural breakdown, opening $150.15 next and then $120.15 below that.
BTH Cash Price Forecast: Can BCH Reach $289.99?
A move to $289.99 would require BCH to first clear the entire $225.53–$246.45 resistance ladder and confirm a breakout above the long-term channel's upper boundary.
That's a multi-stage move rather than a single breakout, and each level would need to hold in turn before the next becomes realistic.
What Could Invalidate the Bullish Setup?
A rejection at the EMA 20/50 cluster, followed by a confirmed close below $188.09, would invalidate the near-term recovery case and confirm the long-term ascending channel has failed. That would open $120.15 as the next major level down.
Bitcoin Cash Price Prediction Methodology
This forecast draws on multiple inputs rather than a single chart pattern: short-term range structure, the long-term ascending channel, EMA positioning across both timeframes, RSI momentum, and broader community context around the Builders Meetup. No single input is treated as decisive on its own.
Bitcoin Cash Price Prediction 2026: Expert View
According to CoinGabbar analysts, BCH is sitting right at a meaningful test—the lower boundary of a long-term ascending channel that's held since June, while the short-term chart shows price still stuck below its EMA cluster.
Neither timeframe has broken decisively yet, and RSI on both readings is neutral to soft rather than stretched, leaving the next move genuinely open.
The Builders Meetup buzz adds some community. sentiment on top of this technical picture, but it isn't a fundamental price driver by itself.
Bitcoin Cash Price Prediction: Data Sources
Price and RSI data for the long-term view referenced from a 1D BCH/USDC chart on Coinbase via TradingView, timestamped August 1, 2026, 12:10 UTC+5:30.
Short-term price and RSI data referenced from a 4H BCH/USDC chart on Coinbase via TradingView, timestamped August 1, 2026, 12:08 UTC+5:30.
Market cap, volume, FDV, and supply data referenced from a CoinGecko-style market tracker, snapshot taken August 1, 2026.
Disclaimer: This piece is for informational purposes only and isn't financial advice. Crypto prices are volatile, and it's worth doing independent research before acting on any of the levels discussed here.













.jpg)




