This $BCH Reversal Could Shock Traders: Bitcoin Cash Price Prediction


Bitcoin Cash split from Bitcoin back in 2017 through a hard fork built around bigger block sizes, aiming to keep transactions fast and cheap for everyday spending rather than just holding.
That "digital cash" identity has stuck with it ever since, positioning $BCH as the pay-at-checkout alternative next to Bitcoin's more store-of-value reputation.
Bitcoin Cash is currently trading at $206.46, down 3.8% over the last 24 hours, after swinging between $205.34 and $215.82 during the session.
Live Market Data
Before getting into where this Bitcoin Cash price prediction leans, here's how BCH is actually positioned in the market right now, based on live data rather than a stale snapshot.
| Metric | Value |
|---|---|
| Price | $206.46 |
| 24h Change | -3.8% |
| 24h Range | $205.34 – $215.82 |
| Market Cap | $4.145B |
| Fully Diluted Valuation | $4.145B |
| 24h Volume | $170.508M |
| Circulating Supply | 20.075M BCH |
| Total Supply | 20.075M BCH |
| Max Supply | 21M BCH |
Source: $BCH market cap data taken from Coingecko, data as of Aug 14, 2026. Figures may vary slightly across other tracking websites.
Liquidation Snapshot
Liquidation data over the past day paints a fairly one-sided picture for Bitcoin Cash.
The 24-hour figure shows $361.42K in total liquidations, and the overwhelming majority of that, $359.08K, came from long positions getting wiped out against just $2.34K on the short side. 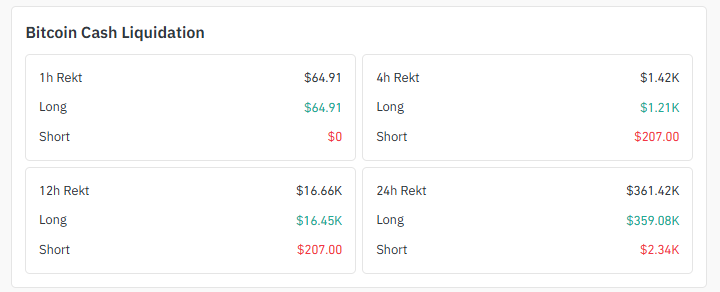
Source: Liquidation Data Taken From Coinglass.
That skew shows up on shorter windows too: the 12-hour window saw $16.45K in long liquidations versus barely $207 in shorts, and even the 1-hour window was 100% long liquidations at $64.91.
In plain terms, traders betting on a bounce have been the ones getting punished throughout this drop, which lines up with the breakdown seen on the 1H chart.
Exchange Volume
Trading volume for Bitcoin Cash over the past 24 hours comes in at $170.508M, with Binance carrying the bulk of it at $62.38M, followed by LBank near $27.52M and OKX around $22.86M. 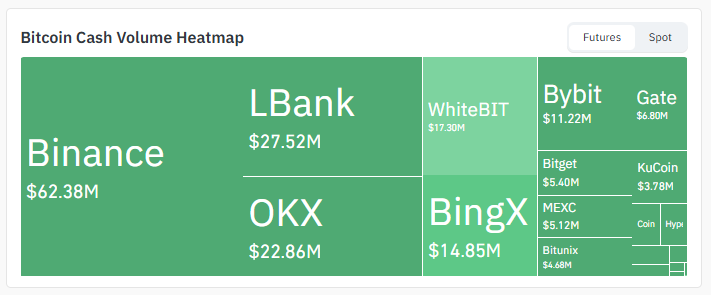
Source: Volume Heatmap Data Taken From Coinglass.
WhiteBIT and BingX add another $17.30M and $14.85M, respectively, with the rest spread thinner across Bybit, Gate, Bitget, MEXC, KuCoin, and Bitunix.
That kind of concentration on one or two venues means price action on Binance specifically tends to set the tone for where Bitcoin Cash moves next, more so than smaller exchanges further down the list.
Key Takeaways
-
Bitcoin Cash is trading at $206.46, down 3.8% over the last 24 hours
-
The 1H chart broke down from a sideways range, now sitting right on $205.2 support
-
1D chart shows BCH still inside a descending channel, testing the upper boundary
-
24h liquidations hit $361.42K, with $359.08K of that from longs alone
-
Binance leads 24h volume at $62.38M out of $170.508M total
Technical Analysis
Hourly Chart Analysis for $BCH Price Prediction
The 1H chart tells a fairly direct story. $BCH had been chopping sideways inside a range for a while, marked by repeated failed pushes toward the top of the box, then broke down out of it, dropping straight through the bottom on rising sell pressure. 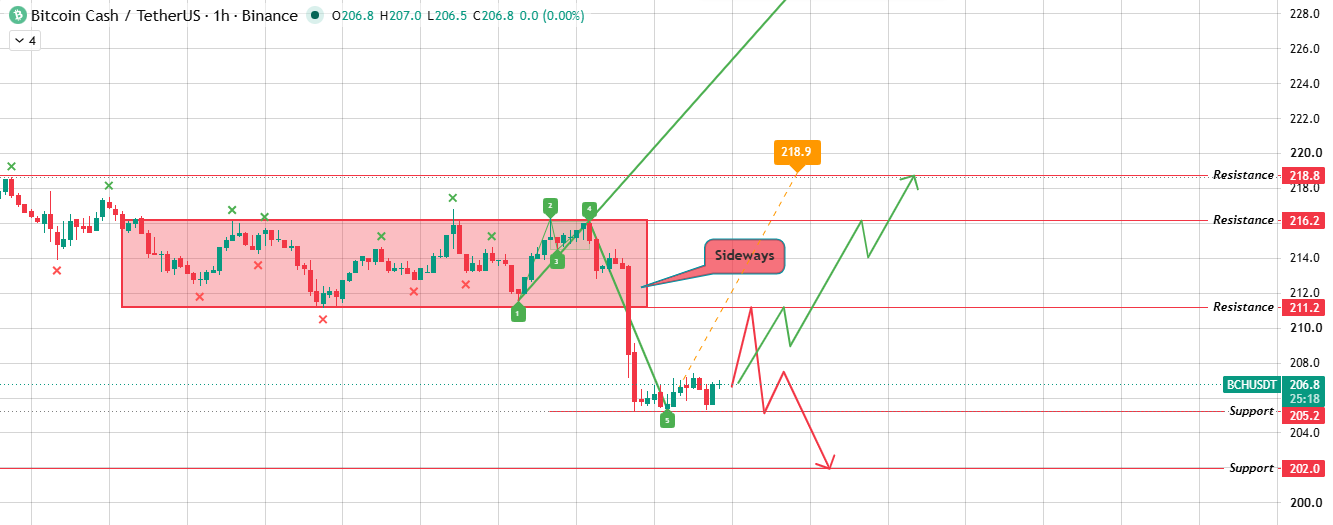
Source: Chart Taken From TradingView.
Price is now sitting right on support near $205.2, with a deeper floor at $202.0 if that gives way too.
Bounce from here and clear the first resistance at $211.2, and the path opens toward $216.2 and then $218.8.
Reading the Wolfe Wave structure on this timeframe also supports projecting continuation into that same upper zone.
But if the price gets rejected at that first resistance and slides back down instead, a break below current support sends it toward that lower $202.0 area, and the sideways range it just left behind would likely act as resistance on any retest.
Daily Chart Analysis
Zoom out to the 1D chart, and $BCH is still inside a descending channel, the kind of pattern where each bounce over the past few weeks has been getting sold into before reaching the previous high.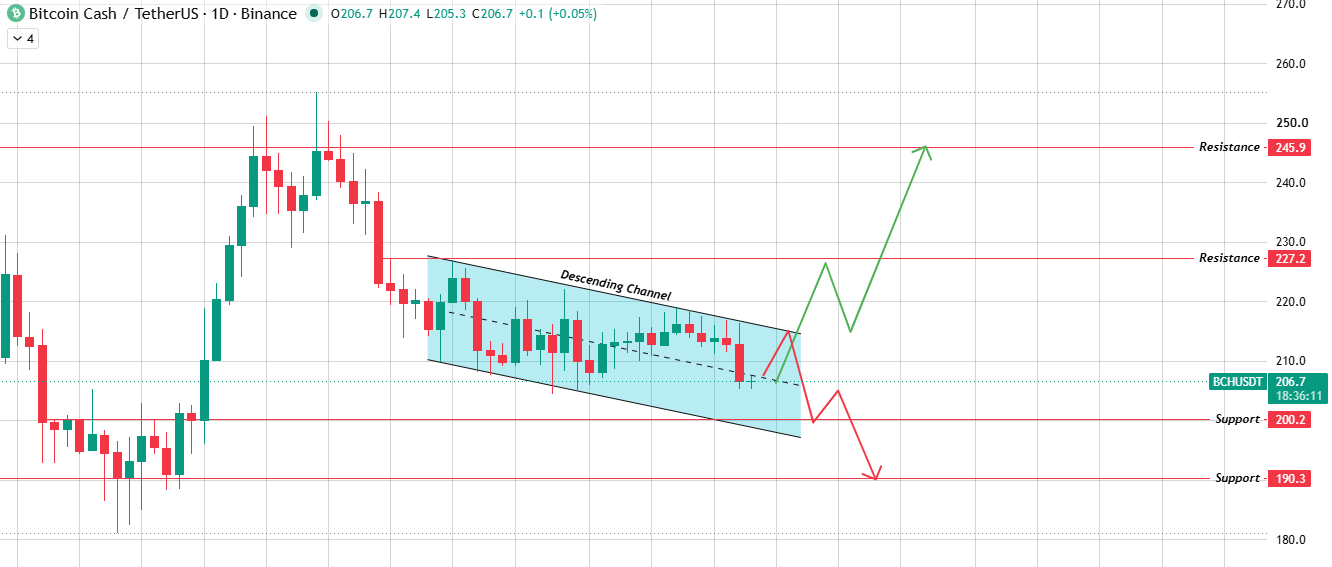
Source: Chart Taken From TradingView.
The price is currently sitting in the middle of the channel, right around where the 1H breakdown originated from.
Break above it with real volume, and $227.2 comes into view, with $245.9 further out as the bigger level if momentum actually carries through.
Get rejected here again, though, and the more likely path is a slide back to the lower boundary, and if that breaks too, $200.2 and then $190.3 open up below as the descending structure reasserts itself.
Bull, Base, Bear Case
This Bitcoin Cash price prediction really comes down to whether the current support zone holds or gives way, since both the 1H and 1D charts are pointing at the same decision point from different angles.
Neither scenario is a lock yet, which is exactly why the table below treats them as equally live outcomes.
| Scenario | Price Level | Conditions | Invalidation |
|---|---|---|---|
| Bull Case | $211.2 – $218.8 | Bounce from $205.2 support and volume-backed break above 1H first resistance | Rejection at $211.2 and close back below $205.2 |
| Base Case | $205.2 – $211.2 range | Price holds between support and first resistance without a decisive break | Close outside either boundary |
| Bear Case | $202.0 – $190.3 | Break below $205.2 support, followed by a break of the 1D channel's lower boundary | Reclaim of $205.2 with strong volume |
Glossary
Sideways Range: a stretch where price bounces between a fairly fixed floor and ceiling without committing to a direction.
Descending Channel: a price structure where each high and low step lower, boxed in by two falling parallel lines.
Resistance Level: a price zone where selling pressure has historically stepped in and stalled upward moves.
Support Zone: a price area where buyers have repeatedly stepped in to catch falling prices.
Wolfe Wave: a five-wave pattern traders use to estimate where price is likely to travel toward next.
Liquidation: the forced closure of a leveraged position when losses eat through the trader's margin.
Methodology
This Bitcoin cash price prediction was built from multi-timeframe chart analysis (1H and 1D) submitted for review and cross-checked against live market data, exchange volume distribution, and liquidation figures. No price levels were extrapolated beyond what appeared in the source charts.
Disclaimer: This article is for informational purposes only and does not constitute financial advice. Cryptocurrency markets are highly volatile, and past chart patterns don't guarantee future outcomes. Always do your own research and consult a licensed financial advisor before making investment decisions.
Also read:

















