Bitcoin Price Prediction: BTC Falls Below $78,000, What Happens Next?


Bitcoin price today slid to $77,623, down 1.57% on the day. The drop comes right after Bitcoin closed out a strong August. Now, renewed U.S.-Iran tensions and fresh Fed rate hike fears are dragging BTC price lower.
The world's largest crypto rallied nearly 25% last month. That was its best month since November 2024. But September has started in the red, which is normal for BTC based on past years.
Traders are also watching the Fed's next move closely. Rate hike odds have jumped this week, and that is putting pressure on risk assets like Bitcoin.
What Is Bitcoin's Price Today?
As of writing, BTC price sits at $77,623, down 1.57% over the past 24 hours. Bitcoin's market cap is close to $1.55 trillion.
Futures volume over the last day came in near $68.43 billion. Spot volume was lighter, around $4.62 billion. Open interest sits close to $53.92 billion.
Metric | Value |
BTC Price | $77,623 |
24h Change | -1.57% |
Market Cap | $1.55T |
24h Futures Volume | $68.43B |
24h Spot Volume | $4.62B |
Open Interest | $53.92B |
Circulating Supply | 20.07M BTC |
Max Supply | 21.00M BTC |
Why Is Bitcoin Price Down Today?
Two things are driving $BTC lower this week. The first is geopolitics. Renewed U.S.-Iran military tension is pushing investors away from risk assets.
The second is the Fed. Traders are now pricing in a higher chance of a rate hike at the September 15-16 meeting.
According to CME Group's FedWatch Tool, markets see a 70.20% probability of a hike to the 375-400 bps range. Only 29.8% expect rates to stay unchanged.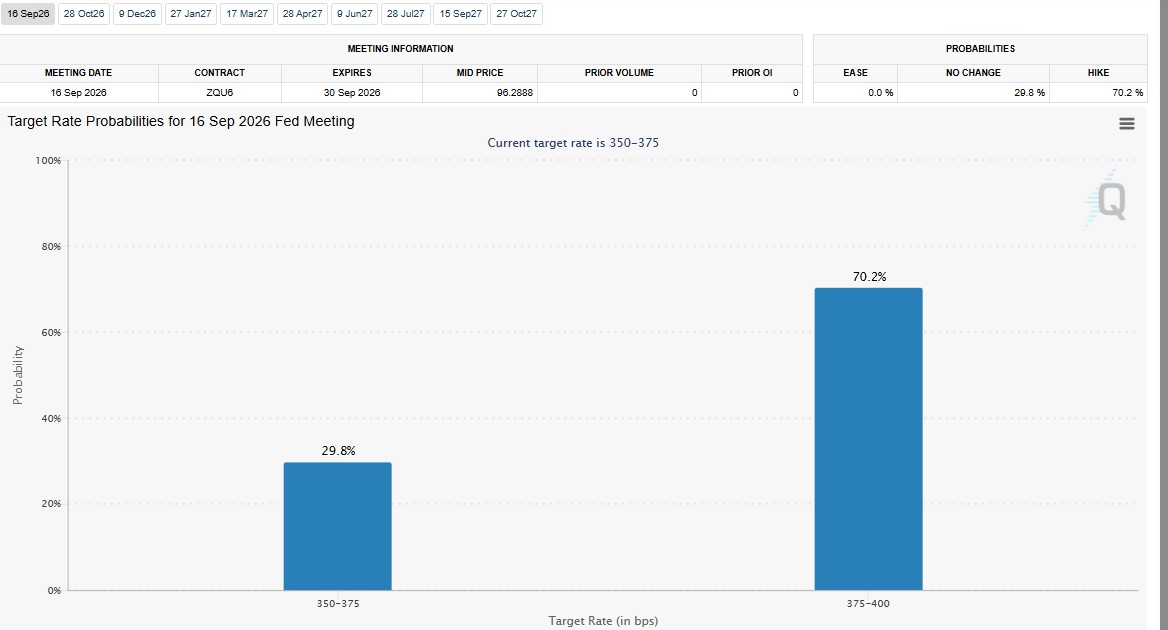
This shift followed a hawkish speech from Fed Chair Kevin Warsh at Jackson Hole, where he signaled the central bank could act if inflation stays sticky.
Rising energy prices tied to the Iran conflict are adding to inflation worries too. That combination is pushing money into the U.S. dollar and out of Bitcoin.
Why Are Bond Yields Affecting Bitcoin Price?
A global sell-off in government bonds is adding fresh pressure on Bitcoin this week. Treasury yields have jumped to their highest level since January 2025, as a bond rout spreads across the U.S., Japan, U.K., France, and Germany.
Higher yields mean higher borrowing costs everywhere, from mortgages to corporate debt. That tends to push investors away from riskier assets like $BTC and toward safer, yield-paying bonds instead.
This bond sell-off is happening at the same time as the Iran conflict and Fed rate fears, which is why Bitcoin has swung sharply between $77,200 and $78,000 in the past few sessions.
Are $BTC ETFs Seeing Outflows Today?
U.S. spot $BTC ETFs started September on a weak note. Early data shows about $236.46 million in net outflows for September 1.
Only three of the 13 funds had reported at the time. BlackRock's IBIT alone made up around $201.2 million of that outflow.
Combined with macro fears, this ETF selling is adding extra weight on Bitcoin's price in the short term.
That said, ETF flows have already flipped once this week. Bitcoin funds pulled in $217 million the following session, just one day after that outflow streak snapped.
This kind of back-and-forth flow is common when markets are digesting big macro news, and it shows institutional demand has not disappeared, even if it looks shaky day to day.
Is Strategy Still Buying Bitcoin?
Strategy, the largest corporate Bitcoin holder, has shifted back into buy mode. The company sold about 6,916 BTC through the summer for roughly $432.5 million, at an average price near $62,500.
Last week, it reversed course. A filing dated August 31 shows Strategy bought 4,603 BTC for $369.7 million, averaging $80,318 per coin. That is its first purchase since June 22, and about $17,800 higher per coin than where it sold.
Strategy's total holdings now stand at 845,050 BTC, with an average cost basis of $75,412. That works out to an unrealized gain of about 3.6% as of the August 31 close.
CEO Phong Le explained the timing on Bloomberg TV. He said the company's buying and selling is not based on BTC price levels, but on its cost of capital.
Selling near $60,000-$65,000 helped fund preferred dividends, while buying near $80,000 made sense once the balance sheet improved.
Le added that Strategy could keep buying even at $90,000, $100,000, or $130,000 if the economics stay favorable.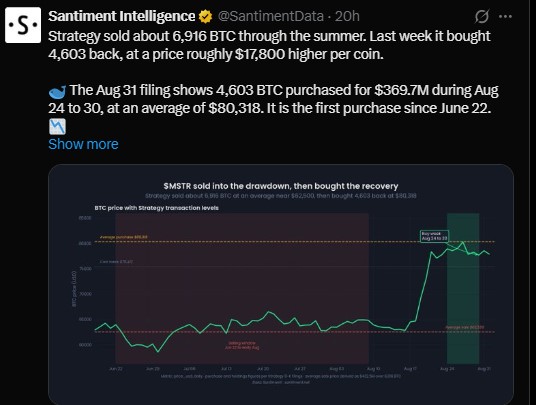
What Does the BTC/USD Chart Show Right Now?
The BTC/USD 1-hour chart shows the asset trading inside a descending channel. Price is currently near $77,576, sitting in the lower-middle part of that channel.
BTC bounced recently from the $76,400-$76,800 zone, which suggests buyers are still defending that level. The RSI reading near 48 points to neutral momentum, not strong buying or selling pressure.
Short-term moving averages are bunched around $77,600-$77,900. That cluster is acting as resistance for now.
Base case: A modest bounce toward $78,000-$78,400 is possible if BTC holds above $76,800-$77,000. A move past $78,400 could open the door to $78,800-$79,200.
Downside risk: Losing the $76,800 support could send the price back toward $76,400, with $76,000 as the next level to watch.
Has Bitcoin Ended Its Bear Market Signal?
A longer-term chart signal is worth watching too. Bitcoin spent most of the second half of 2025 through July 2026 trading below its 50-month moving average, a slow-moving line that smooths out four years of price history.
That has only happened a few times before, including the 2018-2019 bear market and the 2022 crash after the Terra/LUNA and FTX collapses. Both were full crypto winters.
August's strong monthly gain pushed back above that 50-month average for the first time in over a year. That is a meaningful technical shift.
However, the monthly RSI sits at a neutral 50.6, and the ADX trend strength reading is just under the 25 mark needed to confirm a real trend change.
In simple terms, Bitcoin has broken the bear market signal, but it has not yet confirmed a new bull trend. It could still take a few more months to know for sure.
Is Bitcoin Repeating Its 2023 Bottom Pattern?
Some analysts, including Ali Charts on X, point to a possible repeat of Bitcoin's 2023 bottoming pattern.
Back in 2023, BTC tested the top of its price channel three separate times without breaking out. It then fell about 20% toward the mid-range of that channel before finally breaking higher on the fourth attempt.
Today, Bitcoin has already been rejected once near the top of a similar channel. If this pattern plays out again, BTC could see more failed breakout attempts, followed by a pullback toward the $70,000 area, before any real breakout higher.
The chart shared by Ali Charts lays out possible zones for this cycle. On the way down, levels near $90,000, $77,561, $67,000, and $57,000 are marked as areas of interest, echoing the same channel structure from the 2023 chart where BTC ranged between roughly $15,000 and $68,000.
This remains one possible scenario among several, not a guaranteed outcome.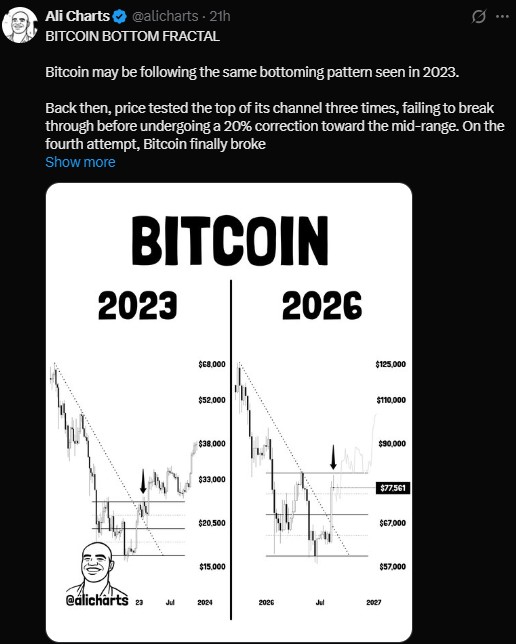
Is September a Bad Month for Bitcoin?
Historically, September has been Bitcoin's weakest month. Coinglass data shows an average return of -2.96% for BTC in September across past years, with a median of -2.44%.
By comparison, August just delivered close to 25% gains, marking two straight positive months for BTC.
Month | Average Return | Median Return |
July | +7.58% | +8.16% |
August | +2.82% | -6.99% |
September | -2.96% | -2.44% |
October | +19.92% | +14.71% |
For 2026 so far, BTC has posted -10.17% in January, -14.94% in February, +1.81% in March, +11.87% in April, -3.41% in May, -20.48% in June, +7.36% in July, and +24.95% in August.
This seasonal pattern does not guarantee this September will follow the same path, but it does explain why some traders are cautious right now.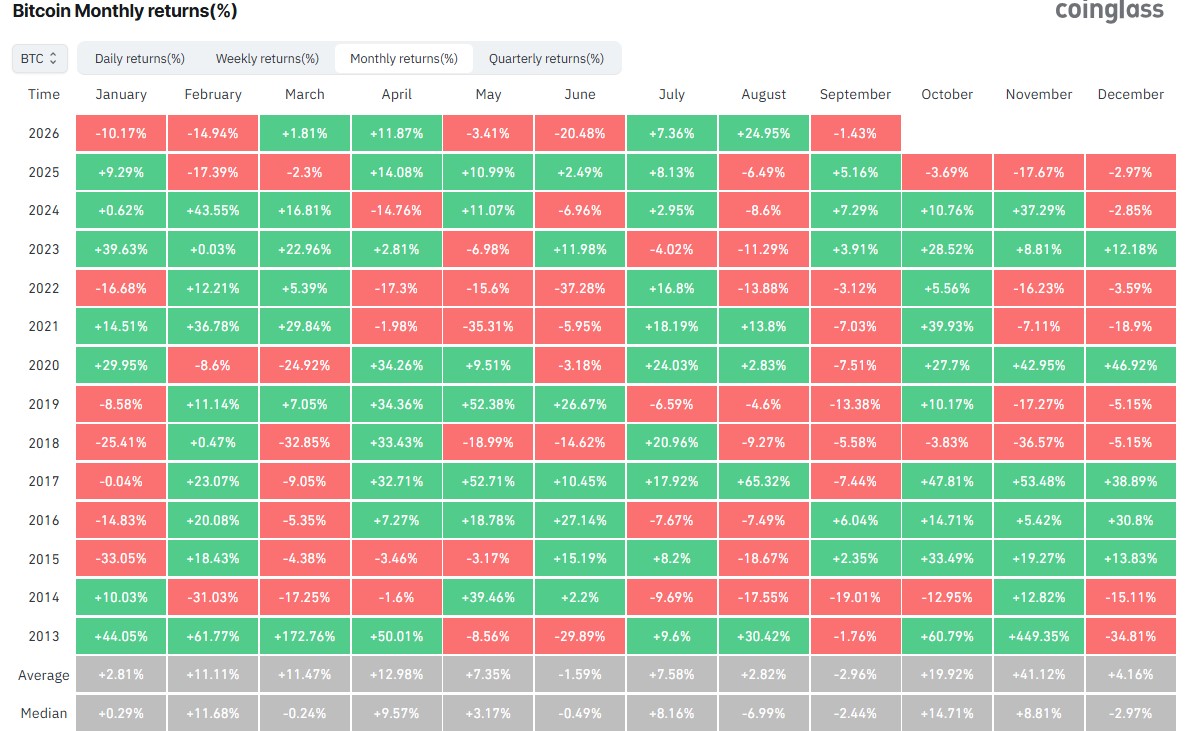
How Much Bitcoin Was Liquidated Today?
Leverage in the market took a hit over the past day. Coinglass data shows 87,779 traders were liquidated, with total liquidations near $339.72 million.
The single largest liquidation order hit on Binance, an ETHUSDT position worth $11.99 million.
Bitcoin's own derivatives data shows a slightly bearish tilt. The 24-hour long/short ratio sits at 0.9451. Liquidations split unevenly too, with $88.72 million in long positions wiped out versus $13.57 million in shorts. That imbalance shows leveraged long traders have taken the bigger hit lately.
Still, account-level long/short ratios on Binance and OKX lean more bullish, at 1.2457 and 1.3 respectively, showing mixed signals between retail positioning and actual pressure in the market.
What's Next for Bitcoin Price?
The next big catalyst lands Friday with the U.S. non-farm payrolls report. Market consensus expects around 58,000 new jobs and 4.1% unemployment.
A weaker jobs number could ease rate hike fears and give Bitcoin room to recover. A stronger number could do the opposite and add to selling pressure.
For now, the $76,800-$77,000 zone looks like the key level to watch. Holding it keeps the door open for a bounce toward $78,000 and beyond. Losing it could open a path back toward $76,000 or lower.
Will Bitcoin Reach $100,000 by the End of 2026?
Some Wall Street voices are still holding onto bigger year-end targets. Standard Chartered has kept a $100,000 Bitcoin price prediction for 2026, though the bank itself admits getting there smoothly looks harder after this pullback.
Strategy's own CEO said the company would keep buying even at $90,000, $100,000, or $130,000, which shows some large holders still expect higher prices over time.
That said, near-term price action depends more on the Fed decision and jobs data this week than on any single long-term call. A $100,000 Bitcoin price by year-end is possible but not guaranteed, and it would likely need ETF inflows to pick back up first.
Disclaimer
This article is for informational purposes only and does not constitute financial, investment, or trading advice. Cryptocurrency markets are highly volatile and carry significant risk. Always do your own research and consult a licensed financial advisor before making investment decisions. Past performance is not indicative of future results.
















