Dogecoin Price Prediction: History Rhymes at DOGE's 615% Zone


Dogecoin launched in December 2013 as a lighthearted token built around a popular internet meme.
It started out as a joke before growing into one of the most recognized names in crypto. Over the years it built a large tipping and payments culture around its community.
High-profile mentions from public figures and platforms have helped keep it in the spotlight well beyond its meme origins.
Anyone searching for a Dogecoin price prediction today will find DOGE trading around $0.08189, down close to 2.0% over the last 24 hours.
Its market capitalization sits near $12.753 billion on a circulating supply of roughly 155.744 billion DOGE. Dogecoin currently ranks among the larger coins by market cap.
Live Market Data
Metric | Value |
Price | $0.08189 |
24h Change | -2.0% |
Market Cap | $12.753B |
Fully Diluted Valuation | $14.04B |
24h Trading Volume | $593.909M |
Circulating Supply | 155.744B DOGE |
Total Supply | 155.744B DOGE |
Max Supply | Unlimited |
24h Range | $0.08038 - $0.0839 |
Exchange Volume
Exchange | 24h Volume |
Binance | $417.71M |
OKX | $224.77M |
Bybit | $93.62M |
WhiteBIT | $89.26M |
MEXC | $79.72M |
Bitget | $67.46M |
Gate | $51.66M |
Bitunix | $41.52M |
BingX | $41.45M |
KuCoin | $11.24M |
Binance and OKX carry the bulk of tracked futures volume by a wide margin. That concentration suggests larger leveraged players are the ones actively testing the wedge boundary right now.
Liquidation Snapshot
Window | Total | Long | Short |
4h | $260.89K | $175.25K | $85.64K |
12h | $1.70M | $1.58M | $119.71K |
24h | $2.60M | $2.43M | $164.36K |
Source: Liquidation Data Taken From CoinGlass, As of Sep 2, 2026
Long liquidations dominate across the 4h, 12h, and 24h windows. That pattern points to leveraged longs taking the bulk of the damage as $DOGE slid toward the lower half of the wedge.
Key Takeaways
DOGE trades near $0.08189, down about 2.0% over the past day, consolidating inside a falling wedge on the 4H chart.
A close above the wedge's falling trendline could open a path toward $0.08591, then $0.09036 and $0.09452.
Rejection at that trendline could push the price to the wedge's rising support line, with a break below opening the way to $0.07800 and $0.07406.
The weekly chart just broke above a long-standing descending triangle and is now testing falling trendline resistance from the same zone that preceded a prior 615% rally.
24-hour liquidations are dominated by long side wipeouts ($2.43M vs $164.36K short), showing leveraged longs absorbed the brunt of the recent pullback.
Analyst Ali Charts says the long-running "$15 Dogecoin" thesis has been technically invalidated after the price broke a multi-year parallel channel.
Technical Analysis of Dogecoin
DOGE Coils Inside a 4H Falling Wedge
On the 4-hour DOGE/USDT chart on Binance, the price is compressing inside a falling wedge, with both trendlines sloping downward toward a narrowing apex.
Confirmation needs a 4H candle close above the wedge's falling upper trendline, backed by volume above the recent average. 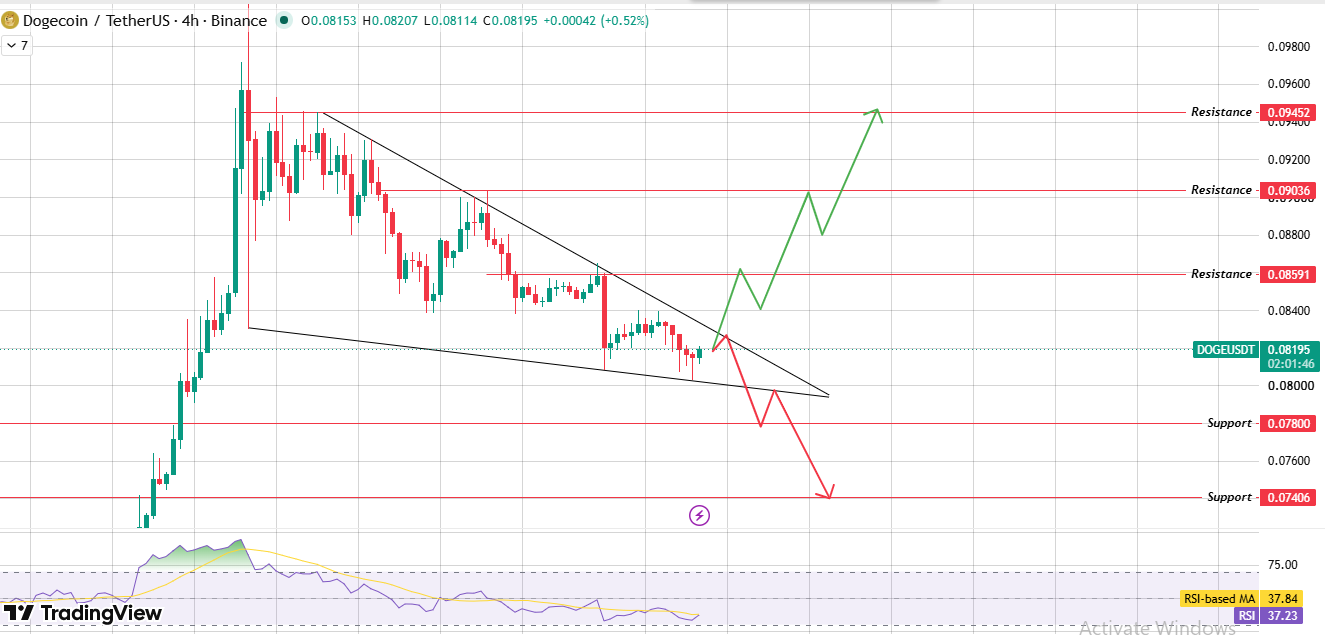
Source: Chart Taken From TradingView, As of Sep 2, 2026
That close would open room toward resistance at $0.08591, then $0.09036 and $0.09452.
Rejection at the trendline instead sends the price toward the wedge's rising lower support line.
A confirmed break below that line would shift near-term bias toward $0.07800 and $0.07406.
Weekly Chart Retests an Old Descending Triangle
There's fresh Dogecoin news for chart watchers on the weekly timeframe. Price recently broke above a long-standing descending triangle and is now testing falling trendline resistance sitting just overhead. 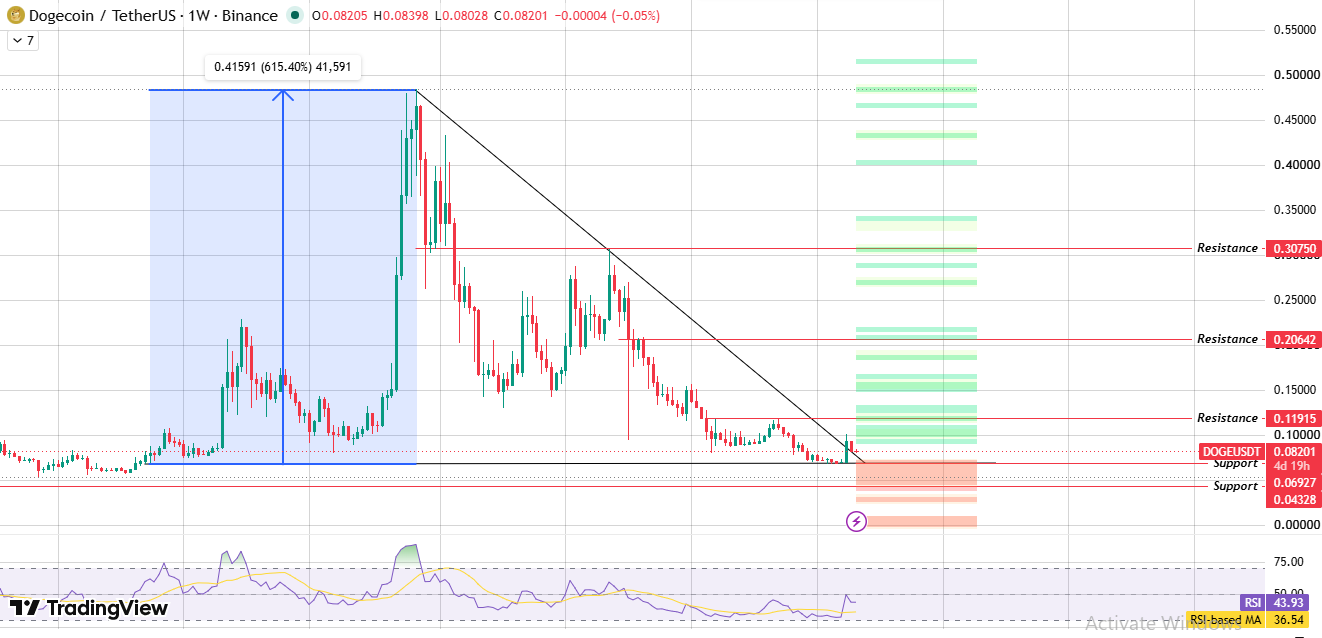
Source: Chart Taken From TradingView, As of Sep 2, 2026
This zone lines up closely with the level DOGE bounced from before, the same support that preceded its earlier 615% rally.
A volume-backed weekly close above this trendline would put resistance at $0.11915 in view, followed by $0.20642 and $0.30750.
Failure to hold above this zone would pull the Dogecoin price back toward $0.06927 and $0.04328.
Support and Resistance Levels
4H Chart Levels
Level | Price |
Resistance 3 | $0.09452 |
Resistance 2 | $0.09036 |
Resistance 1 | $0.08591 |
Support 1 | $0.07800 |
Support 2 | $0.07406 |
Level | Price |
Resistance 3 | $0.30750 |
Resistance 2 | $0.20642 |
Resistance 1 | $0.11915 |
Support 1 | $0.06927 |
Support 2 | $0.04328 |
Scenario | Price Range | Key Trigger |
Bull Case | $0.08591 – $0.09452 | The 4H candle closes above the falling wedge trendline on rising volume, and the weekly resistance above gives way. |
Base Case | $0.07800 – $0.08591 | Price stays trapped between the wedge's two trendlines without a decisive break. |
Bear Case | $0.07406 and below | Wedge trendline rejection breaks the rising support line while weekly resistance holds firm |
Analyst Ali Charts, in a widely shared post, laid out the technical basis behind a long-standing $15 Dogecoin price target.
That target rested on a rising parallel channel said to have defined DOGE's price action since its earliest days.
Prior touches of the channel's lower boundary had preceded rallies of 9,221% in 2017 and 30,694% in 2020, according to the same post. 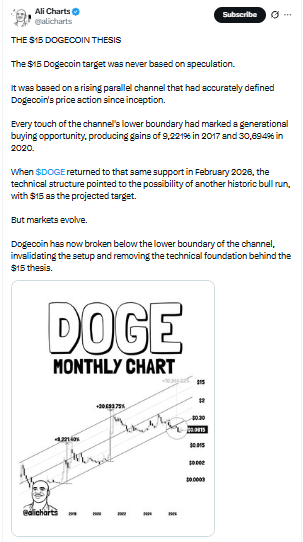
Source: Data Taken From @alicharts, X Account, As of Sep 02, 2026
Dogecoin returned to that same support zone again in February 2026, which is what originally revived talk of the $15 target this year.
But markets evolve, and according to that same post, Dogecoin has now broken below the channel's lower boundary.
The analyst says that break removes the technical foundation behind the $15 target entirely. This is one analyst's read on a long-term chart structure, not a confirmed outcome.
It's worth weighing alongside the shorter-term wedge and triangle patterns detailed above rather than treating them as standalone signals.
Market Pulse
Sentiment around Dogecoin looks cautious this week. Heavy long-side liquidations over the past 24 hours point to leveraged buyers getting flushed out during the recent pullback.
That kind of flush tends to cool short-term enthusiasm, even when the broader weekly structure still looks constructive after the triangle breakout.
Exchange activity concentrated on Binance and OKX suggests larger players, rather than retail crowds, are the ones driving positioning right now. That kind of positioning can make near-term moves feel sharper than usual.
Glossary
Falling wedge: Two downward-sloping lines that squeeze the price into a tightening range. A confirmed close above the upper line is often read as bullish, though volume needs to back it up before it means much.
A descending triangle looks a little different. Picture a flat line underneath and a sloped line pressing down from above. Traders usually watch a break above that sloped line as a shift away from the prior downtrend.
That shift matters more when it follows a long stretch of lower highs, like DOGE's weekly chart shows.
Liquidations happen when an exchange force closes a leveraged position because the trader can no longer cover the potential loss. A wave of long liquidations, like $DOGE saw over the past day, usually lines up with a fast move lower.
The parallel channel Ali Charts references is a two-line structure, with both lines sloping in the same direction and staying roughly equal distance apart. Long-term traders sometimes use touches of the lower line as a signal that a bigger move could be starting.
RSI, or relative strength index, measures how fast and how far the price has moved recently. A reading below 40, close to where DOGE sits now on the 4H chart, often reflects a market that has cooled off after a stretch of selling.
Methodology
This Dogecoin price prediction draws on two Binance charts viewed through TradingView, a 4-hour timeframe and a weekly timeframe.
Live data on price, market cap, supply, exchange volume, and liquidations rounds out the picture. Every level cited here comes directly from those charts rather than an outside calculator.
The $15 Dogecoin thesis referenced in the Expert Opinion section comes from a public post by analyst Ali Charts.
That post is attributed directly and treated as one analyst's interpretation, not a verified market outcome.
This keeps in line with how this Dogecoin price prediction handles outside commentary throughout.
Both the 4H and weekly candles referenced were still open at the time this analysis was written. Confirmation rules built around closing price and volume matter more here than assuming either breakout has already played out.
Disclaimer: This article is for informational purposes only and does not constitute financial or investment advice. The bull, base, and bear scenarios above come from technical chart patterns and carry meaningful uncertainty. Dogecoin can move by double-digit percentages within a single session. Any of these outcomes, including the shorter-term wedge scenarios and the longer-term channel thesis, could fail to play out as described. Only invest funds you can afford to lose, and consult a licensed financial advisor before making investment decisions.
















