Bitcoin Price Forecast: BTC Stalls at $80K as Profit-Taking Begins


Bitcoin is trading near $77,000 after a sharp 22% rally over the past eight days. The move pushed the coin from roughly $63,000 to a peak close to $80,000 before cooling off.
Now traders are watching a packed week of U.S. economic data. PCE inflation, revised GDP numbers, and Fed Chair Kevin Warsh's first Jackson Hole speech could all shake the market.
This Bitcoin price prediction looks at where BTC stands right now, what the charts and on-chain data show, and what might happen next.
What is Bitcoin's price today?
The asset is changing hands around $76,937, up about 0.9% on the day. The coin briefly touched close to $80,000 last week before slipping back into a tighter range.
Futures volume over the past 24 hours sits near $58.79 billion, while spot volume is at $4.57 billion. Open interest is holding around $55.33 billion, showing traders are still actively positioned in the market.
The long/short ratio is roughly balanced at 1.0052, meaning neither bulls nor bears have a strong grip right now.
Why did Bitcoin rally 22% in eight days?
The rally followed the U.S. Treasury's decision to expand liquidity-support buybacks for longer-dated government debt. Starting September 9, the maximum operation size rises from $2 billion to at least $4 billion.
This is a debt-management move, not quantitative easing. Still, it helped push some long-term yields lower and improved demand for riskier assets like Bitcoin.
Spot BTC ETFs also saw strong inflows. Roughly $517 million flowed in on August 19, followed by another $606 million on August 20, based on tracked ETF data.
Short sellers were caught off guard too. As Bitcoin broke higher, forced liquidations of bearish bets added extra fuel to the move.
What do on-chain metrics say about selling pressure?
On-chain analyst Axel Adler Jr. flagged a notable shift on August 24. The share of short-term holder supply sitting in profit jumped to 74.9% from just 26.1% as the asset climbed from $63,000 to $77,000.
That means most recent buyers are now sitting on gains, which historically raises the odds of profit-taking.
Exchange inflows from short-term holders also flipped positive, reaching 28,600 BTC on August 24. Just over a week earlier, that figure was negative 18,700 BTC.
Adler said the risk of short-term overheating would rise further if exchange inflows stay above 25,000 BTC, if profit share nears 90%, and if the rally starts losing steam. If prices hold steady and inflows fade back toward zero instead, a calmer consolidation phase could follow.
What are Bitcoin's key support and resistance levels?
The coin is moving inside a descending channel on the hourly chart, trading close to $77,020.
Level Type | Price Zone |
Resistance | $78,000 – $78,500 |
Bollinger Upper Band | ~$77,840 |
Bollinger Middle Band | ~$77,320 |
Bollinger Lower Band | ~$76,799 |
Support | $75,500 – $76,000 |
Next Support | $70,000 – $72,000 |
The RSI sits around 47, which points to neutral, slightly weak momentum rather than a strong trend in either direction.
A break above $78,500 could open the door toward $79,500 and then $80,000. A drop below $76,000 could send price testing $75,000, and possibly $74,000 after that.
Liquidity data shows a smaller cluster around $76,500, with much larger clusters sitting between $78,500 and $80,000. That setup suggests Bitcoin could see a small retrace before pushing back toward $80,000, based on current positioning.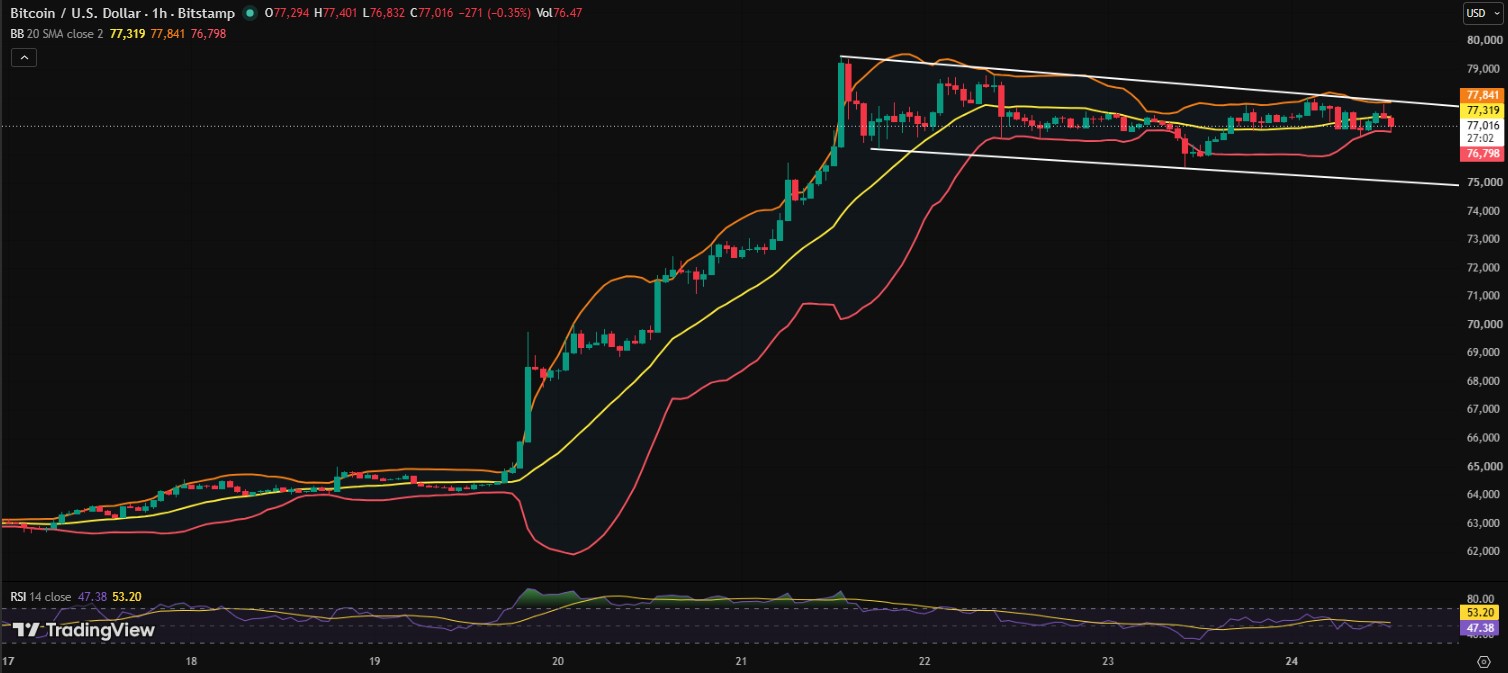
Source: Binance BTC/USDT liquidation heatmap, Coinglass.
Liquidations over the past 24 hours totaled about $61.59 million, split between $26.07 million in long liquidations and $35.52 million in short liquidations.
Will the Fed's Jackson Hole speech move Bitcoin price?
This week brings three major events. July's PCE inflation data and the second GDP estimate both land Wednesday morning. Core PCE rose 3.3% annually in June, and the Cleveland Fed's nowcast points to a similar reading for July.
Kevin Warsh delivers his first Jackson Hole address as Fed Chair on Friday at 10 a.m. ET. This year's theme centers on financial innovation and payments policy.
Markets are watching for tone. A dovish message could support a push toward $80,000. A hawkish tone may send $BTC back toward $73,000. A neutral speech could simply keep price chopping in its current range.
The asset has shown heavy volatility around every Jackson Hole event since 2022, based on historical price behavior around the symposium.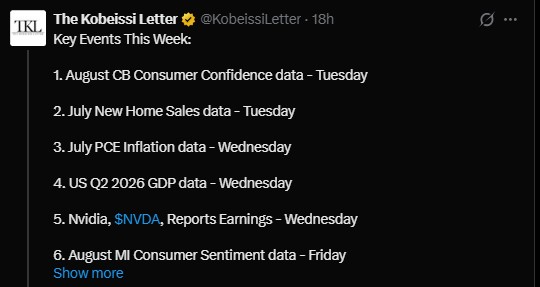
What other events could move Bitcoin price today?
Treasury Secretary Scott Bessent held a press conference Monday at 2 p.m. ET to detail sweeping new economic measures against Iran. He had earlier written in the Financial Times that dawn would mark the start of what he called the biggest financial offensive ever launched against an adversary.
The plan targets Iran's oil trade, banking networks, and countries doing business with Tehran, following months of a US-Iran conflict. Bessent has called it the toughest sanctions package in history.
Geopolitical headlines like this can add short-term volatility to risk assets, including Bitcoin, especially when they land alongside a heavy macro data week.
On the technical side, some traders are watching Bitcoin's weekly RSI. A break of its current downtrend is seen by some chart watchers as a signal that could open the door toward $100,000, though this remains a chart-based view rather than a confirmed signal.
The coin also posted its largest weekly candle since 2023 and reclaimed both the Bull Market Support Band and its 200-day moving average. This same setup has appeared twice in the past two bear markets. It failed to hold in 2018, but marked the market bottom in both 2019 and 2023.
Whether this reclaim holds will likely depend on how markets digest both the Fed's tone at Jackson Hole and the fallout from the new Iran sanctions.
Bitcoin remains in a consolidation phase just below its recent highs. The $76,000 to $78,500 range looks like the battleground for the coming days.
Macro data and Fed commentary will likely decide which way price breaks. Traders watching Bitcoin price prediction models this week should keep an eye on both the PCE report and Warsh's tone on Friday.
Bottom line for Bitcoin traders this week
Bitcoin remains in a consolidation phase just below its recent highs. The $76,000 to $78,500 range looks like the battleground for the coming days. Once Bitcoin breaks its weekly RSI downtrend, this bull market goes wild; $100,000 is next.
Macro data and Fed commentary will likely decide which way price breaks. Traders watching Bitcoin price prediction models this week should keep an eye on both the PCE report and Warsh's tone on Friday.
Disclaimer: This article is for informational purposes only and does not constitute financial, investment, or trading advice. Cryptocurrency markets are highly volatile and carry significant risk of loss. Always conduct your own research and consult a licensed financial advisor before making investment decisions.
Also read:












.webp)




