Official Trump Price Prediction: $TRUMP Up 78%. Can It Keep Going?

$TRUMP launched in early 2025 and has stayed one of the more heavily traded politically branded tokens ever since, for better or worse.
Right now it's sitting around $2.50, off about 2% on the day, though that's after nearly doubling over the past week alongside a broader crypto rebound and fresh attention on Trump-linked crypto events.
In this Official Trump Price Prediction, here's what the hourly chart, positioning data, and exchange flows are pointing to next.
Live Market Data
Metric | Value |
Price | $2.50 |
24h Change | -2.0% |
24h Range | $2.44 - $2.91 |
Market Cap | $627.441M |
Fully Diluted Valuation | $2.501B |
24h Trading Volume | $775.183M |
Circulating Supply | 250.868M |
Total Supply | 1B |
Max Supply | 1B |
Source: $TRUMP market cap data taken from Coingecko, data as of Aug 24, 2026. Figures may vary slightly across other tracking websites.
Liquidation Snapshot
Window | Total Liquidated | Longs | Shorts |
1 Hour | $134.42K | $72.87K | $61.55K |
4 Hour | $342.39K | $238.83K | $103.56K |
12 Hour | $2.14M | $1.62M | $519.94K |
24 Hour | $10.08M | $4.66M | $5.43M |
Source: Liquidation data taken from Coinglass.
Longs got hit harder over the 4-hour and 12-hour windows, which makes sense given the pullback caught a lot of bulls leaning the wrong way after last week's spike.
Zoom out to 24 hours and it evens out more, with longs and shorts roughly split, which just reflects how choppy the last day has been.
Exchange Volume
Binance and OKX are carrying most of the futures volume here, $1.10B and 784.65M over the last 24 hours, respectively.
Bybit ($280.55M) and Bitget ($179.59M) are a distant third and fourth, with Gate, Hyperliquid, and Bitunix filling out the rest at $118.81M, $64.03M, and $62.72M.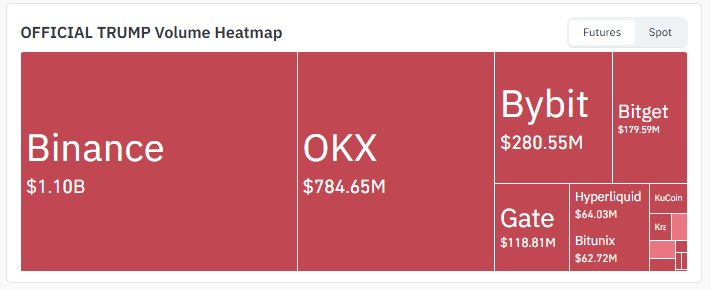
Source: Volume Heatmap Data Taken From Coinglass.
Nothing unusual there; the fact that volume is concentrated on the big venues rather than scattered across smaller exchanges suggests this is real trading interest, not something being pumped on a single low-liquidity platform.
Official Trump News
The move hasn't gone unnoticed on social media. BSCN (@BSCNews) posted on X highlighting that the $TRUMP memecoin has nearly doubled in price this week, tying the rally to the broader crypto market recovery and a recent crypto-focused meeting involving @realDonaldTrump at the White House. 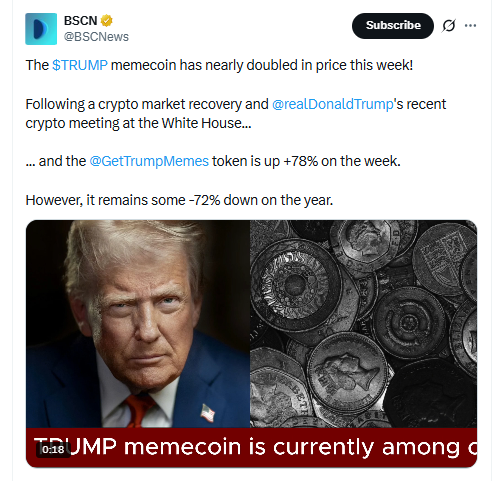
Source: Data Taken From @BSCNews, X Account.
The post puts the @GetTrumpMemes token's weekly gain at +78%, but it also flags the bigger picture, noting TRUMP is still down around -72% for the year.
That gap between the weekly and yearly numbers is worth sitting with.
A 78% weekly pop looks impressive in isolation, but it's happening off a badly beaten-down base.
The token has spent most of the year clawing back from a much steeper drawdown, and this week's move is one strong bounce inside that longer downtrend, not proof the downtrend is over.
Key Takeaways
TRUMP is around $2.50, down 2% today, cooling off after nearly doubling last week.
Everything right now comes down to a symmetrical triangle that's built up on the 1-hour chart.
Break above it on real volume, and $2,938 is the first target, with $3,204 and $3,679 possible if buyers keep pushing.
Get rejected at the top and lose the lower boundary instead, and $2.243 comes into view, maybe $1.973 if selling picks up.
Longs have absorbed most of the recent liquidations, a sign the rally is losing a bit of steam for now.
Binance and OKX are where the real volume is, which is generally a good sign for a token this size.
Technical Analysis: A Triangle After the Spike
$TRUMP ripped higher earlier in the week, then spent the following hours grinding sideways into a symmetrical triangle of low highs and higher lows, squeezing toward each other just above the 2.24 to 2.55 area.
Which way it breaks is really the whole story here.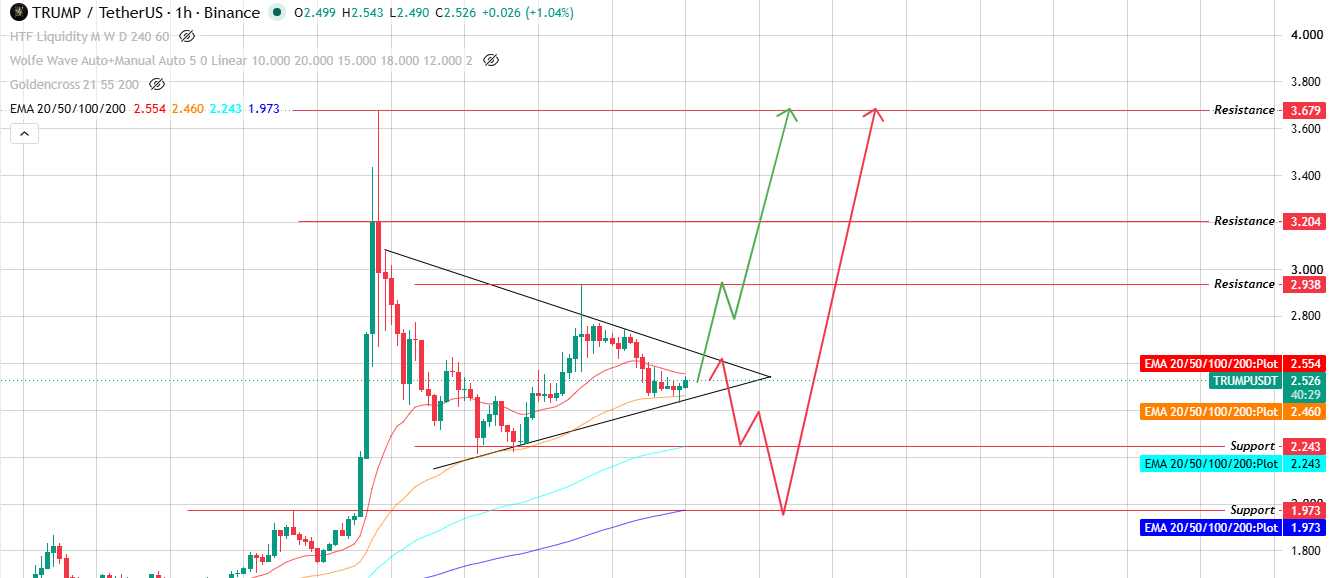
Source: Chart Taken From TradingView.
A clean move above the upper boundary, backed by volume, points first toward $2.938. If that gives way too, $3.204 and then $3.679 become realistic next stops.
The other path: price tags the top of the triangle, gets turned away, and then slices through the lower boundary on its way down.
That would say buyers are running out of gas, and $2.243 becomes the level to watch, with $1.973 possible if the drop has legs.
Support and Resistance Levels
Level Type | Price |
Resistance 3 | $3.679 |
Resistance 2 | $3.204 |
Resistance 1 | $2.938 |
Current Price | $2.50 |
Support 1 | $2.243 |
Support 2 | $1.973 |
Bull, Base, and Bear Case
Scenario | Setup | Level | Invalidation |
Bull | Triangle breaks up on volume, clears $2.938 | $3.204 - $3.679 | Below $2.243 |
Base | Price keeps coiling inside the triangle. | $2.243 - $2.938 | Break of either boundary |
Bear | Rejected at the top, breaks the lower boundary | $2.243 - $1.973 | Reclaim of $2.938 |
Glossary
Symmetrical triangle: A pattern where lower highs and higher lows squeeze together into a point, usually right before the price picks a direction.
Breakout: Price is finally pushing past a level or line that had been holding it back, often with a jump in volume.
The rejection: Price hits resistance and gets pushed straight back down instead of breaking through.
Liquidation: A leveraged position getting force-closed once losses eat through the trader's margin. A cluster of these in one direction tends to fuel the move further that way.
Support: A price zone where buyers have historically stepped in and stopped a decline.
Resistance: The opposite: a zone where sellers have historically capped a rally.
Methodology
This is built off the 1-hour chart, current liquidation data, exchange volume figures, and live market pricing. All levels here come straight from the chart, with nothing extrapolated.
Disclaimer: This article is for informational purposes only and does not constitute financial, investment, or trading advice. Cryptocurrency markets, including Official Trump (TRUMP), are highly volatile and speculative. Any price levels or scenarios discussed are probability-based observations drawn from technical and derivatives data, not guarantees. Please conduct your own research and consult a qualified financial advisor before making investment decisions.
Also read:












.webp)




