Crypto Market Watches US PCE, Jobs, Jackson Hole & GDP Data This Week


The crypto market is heading into a busy week of US economic data. Traders are watching PCE inflation, jobs numbers, and GDP growth all at once. Fed Chair Kevin Warsh will also speak at Jackson Hole, adding another layer to an already loaded calendar.
Bitcoin price today sits near $77,020 after posting its biggest weekly candle since 2023. Ethereum price trades around $2,444, up 2.7% in a day. XRP price has cooled off to $1.48 after a sharp four-day run.
Each of these coins now faces a test. The next few days of US data could decide whether the recent rally holds or fades.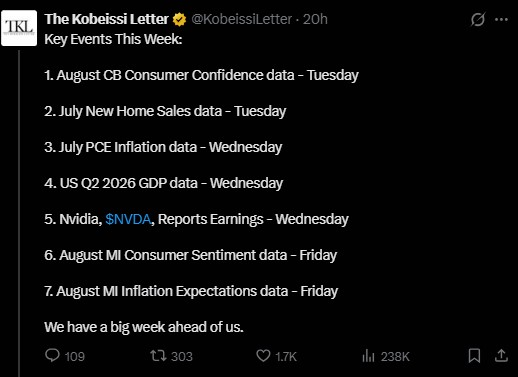
Why Does PCE Inflation Data Matter for Bitcoin Price Today?
PCE inflation is the Federal Reserve's favorite way to measure price pressure. It comes out Wednesday for the month of July.
Economists expect the headline number to rise 0.1% month-on-month. That follows a 0.1% drop in June. The yearly rate is forecast at 3.6%, down slightly from 3.7%.
Core PCE, which strips out food and energy, is expected to climb 0.2% for the month. The yearly core reading is seen at 3.3%.
Both figures sit well above the Fed's 2% target. A hotter-than-expected print could push back rate cut hopes. A cooler number could do the opposite and lift risk appetite across the crypto market.
What Jobs Data and GDP Numbers Are Coming This Week?
GDP growth data lands Wednesday too. Analysts expect 1.5% annualized growth for the second quarter. That is down from 2.1% in the first quarter.
Slower growth alongside sticky inflation is a tricky mix for the Fed. It raises the odds of debate at the September meeting.
Weekly jobless claims arrive Thursday. Initial claims for the week ending August 22 are forecast to hold steady at 206,000. Stable claims suggest the labor market is not falling apart, even if it isn't roaring either.
Why Does the Jackson Hole Fed Speech Matter for Crypto?
Fed Chair Kevin Warsh will speak at the Jackson Hole symposium this week. His comments often move markets more than the data itself.
Investors want to know how he reads the inflation and growth picture together. Any hint about the pace of future rate moves could ripple straight into crypto news today.
Liquidity conditions and dollar strength tend to follow Fed tone closely. That makes his remarks a key event for Bitcoin and altcoins alike.
Separately, Treasury Secretary Scott Bessent announced new sanctions on Iran's oil and banking networks Monday. Headlines like this can add short bursts of volatility to risk assets during a data-heavy week.
Bitcoin Price Prediction: What Are the Key Levels to Watch?
Bitcoin trades inside a descending channel on the hourly chart near $77,020. The RSI reads around 47, which points to neutral, slightly weak momentum.
Level Type | Price Zone |
Resistance | $78,000 – $78,500 |
Bollinger Upper Band | ~$77,840 |
Bollinger Middle Band | ~$77,320 |
Bollinger Lower Band | ~$76,799 |
Support | $75,500 – $76,000 |
Next Support | $70,000 – $72,000 |
A break above $78,500 could open the door toward $79,500 and then $80,000. A drop below $76,000 could send price down to test $75,000, and possibly $74,000 after that.
Liquidity data shows a smaller cluster near $76,500. Much bigger clusters sit between $78,500 and $80,000. That setup hints Bitcoin could see a small retrace before another push higher.
On-chain analyst Axel Adler Jr. flagged a shift on August 24. Short-term holder supply in profit jumped to 74.9% from 26.1% as Bitcoin climbed from $63,000 to $77,000. Most recent buyers now sit on gains, which historically raises the odds of profit-taking.
Bitcoin also reclaimed both the Bull Market Support Band and its 200-day moving average. This same setup showed up twice in past bear markets. It failed in 2018 but marked the bottom in 2019 and 2023.
Some traders are watching the weekly RSI for a break of its downtrend. Chart watchers see that as a signal that could open the door toward $100,000, though this remains a chart-based view rather than a confirmed signal.
Ethereum Price Prediction: Can ETH Clear Its Next Resistance?
Ethereum price today trades around $2,444, up about 2.7% over the past day. The move follows a notable technical signal that flashed earlier this month.
Ethereum's next real test sits between $2,722 and $2,970. URPD data shows roughly 16.70 million ETH were originally bought within this band, making it a heavy supply zone. Many holders may sell once price returns to their entry point.
If Ethereum clears this zone, the next MVRV pricing band points to around $5,363, based on the 2.4 MVRV level. A rejection and pullback toward the realized price near $2,235 also remains a reasonable outcome.
Arthur Hayes, speaking on a recent podcast, called Ethereum one of the more disliked large-cap altcoins right now, even though it still trades below its 2021 all-time high. Hayes said ETH remains his biggest holding at Maelstrom outside of bitcoin, and a move above $3,000 could open a path toward $5,000.
Trader Ted Pillows pointed out that Ethereum's drop below $1,550 earlier this year may have been a false breakdown. With that level reclaimed, some traders believe the cycle bottom for ETH is already behind it.
A clean break above 2,722-2,970, paired with whale accumulation and exchange outflows, would strengthen the bullish case. Tom Lee and Arthur Hayes have both pointed to $5,000 as a plausible target if momentum continues to build.
XRP Price Prediction: Will XRP Hold Its Support Zone?
XRP price today sits at $1.4819, down from a recent high of $1.70. The token climbed roughly 70% in four days from around $1, then pulled back once Bitcoin slipped below $76,000 and leveraged long positions got closed out.
Technical Area | XRP Level | Market Implication |
First support | 1.35–1.40 | Holding here supports the recovery structure |
Major resistance | $1.70 | Breakout needs stronger spot demand |
Near-term upside | 1.80–2.00 | Possible targets after confirmed breakout |
Larger psychological level | $3.00 | Longer-range level, not a base case |
The first important support sits between $1.35 and $1.40, lining up with the 0.382 Fibonacci retracement zone.
If price holds 1.35-1.40, buyers could try to rebuild momentum toward $1.70. A breakout would need clear spot-volume confirmation to reduce the risk of another rejection.
If XRP loses $1.35 on strong selling, the bullish structure becomes less convincing. Traders would then watch whether the market can form a new base before another recovery attempt.
Bitcoin's next move and the September regulatory calendar could decide which side breaks first.
How Much Was Liquidated in the Crypto Market Today?
The wider crypto market saw about $297.98 million in liquidations over the past 24 hours.
Asset | Liquidations |
Ethereum | $93.54M |
Bitcoin | $60.75M |
XRP | $21.58M |
Overall, $143.10 million in long positions and $154.89 million in short positions were wiped out. A total of 73,284 traders were liquidated. The largest single order was an ETHUSDT position worth $6.86 million on Binance.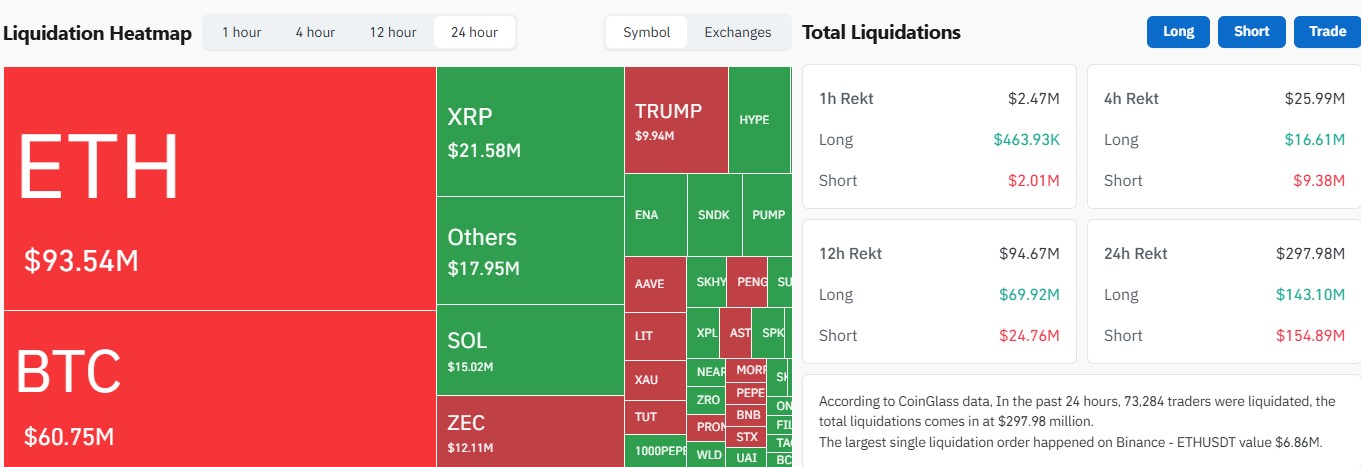
What This Means for Crypto Market Sentiment This Week
The crypto market has grown more tied to traditional macro data over the past few years. That reflects more institutional money flowing into digital assets, where portfolio decisions often weigh the same factors that guide stock and bond investors.
With PCE, GDP, jobless claims, and a Fed speech all landing in the same week, sharp price swings are possible. Traders often reposition ahead of major releases, and any surprise versus forecasts tends to trigger fast moves.
Bitcoin price action this week may act as a gauge for how sensitive the broader market remains to these signals. Altcoins, which often move with Bitcoin, could see amplified reactions depending on how the data compares to expectations.
Disclaimer
This article is for informational purposes only and does not constitute financial, investment, or trading advice. Cryptocurrency markets are highly volatile and involve substantial risk of loss. Prices mentioned reflect market conditions at the time of writing and can change rapidly. Always conduct your own research and consult a licensed financial advisor before making investment decisions.












.webp)




