Casper Price Prediction: $CSPR Kraken Listing Sparks a Sharp Breakout


Something shifted for this Layer 1 network almost overnight, and traders who ignored it for months are suddenly paying close attention again. A quiet coin just forced its way back into the conversation.
Everyone Suddenly Cares About This Layer 1 Coin Again
A Casper price prediction usually does not make headlines, but this week is different. CSPR spent most of the summer drifting sideways, ignored, barely worth a second look. Then a listing hit, an exchange promotion followed, and the chart woke up. We watched the order books shift in real time as new volume rolled in from a major venue. What changed, and can it hold? That is the question everyone is quietly asking. This piece walks through the catalyst, the current market structure, and three realistic paths the price could take from here, without pretending any of them are guaranteed.
Key Takeaways
-
CSPR jumped roughly 19% in 24 hours after a fresh Kraken listing and exchange trading promotion.
-
Price broke out of a multi-month descending channel on the daily chart.
-
RSI near 80 signals an overbought short-term condition worth watching.
-
Base case for the next 30 days sits between $0.025 and $0.045.
-
A daily close back below $0.020 would weaken the near-term bullish case.
Why Is Casper Price Moving Today
Here's the thing: this rally has an actual source, not just hype. Casper Network confirmed its CSPR listing news on Kraken, and the exchange followed up with a trading promotion offering 15.9 million CSPR to active participants. Over 3,500 traders had already joined the promotion within hours of it going live.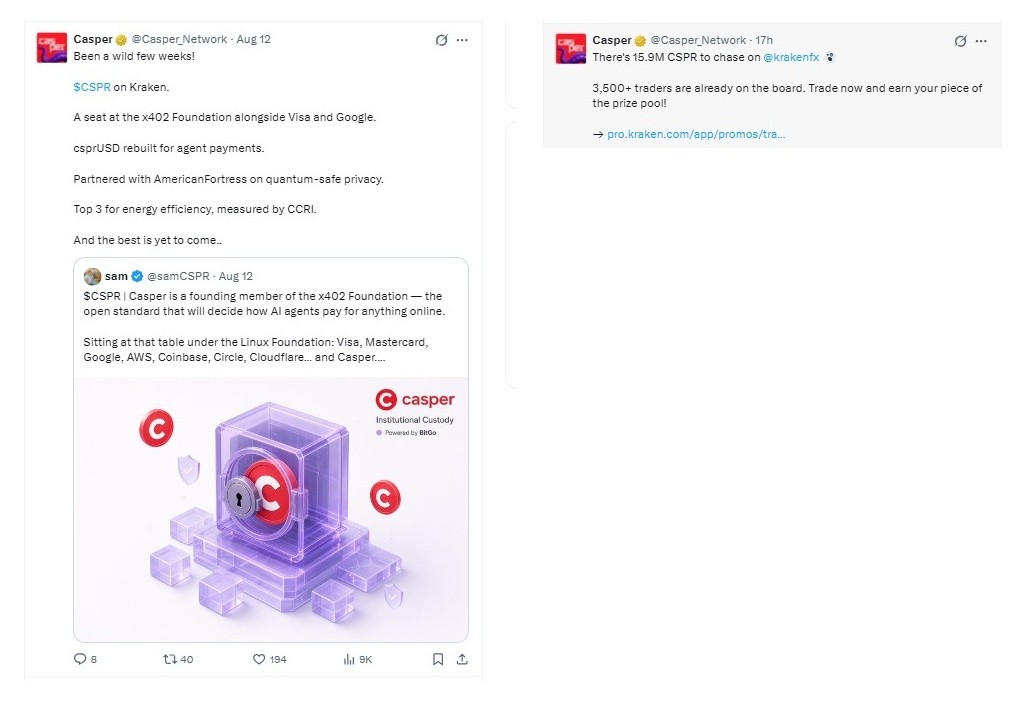
But listings alone rarely move a chart this fast. Casper also announced a seat at the X402 Foundation, sitting alongside Visa, Google, Mastercard, and Coinbase on a payments standard for AI agents, a theme that keeps showing up across recent AI crypto news. It rebuilt CSPRUSD for agent-based payments and partnered with AmericanFortress on quantum-safe privacy tooling. Turns out, three catalysts landing in one week is rare. Traders noticed. Volume followed.
Casper Price Today: Market Snapshot
As of 08:52 UTC on August 17, 2026, CSPR trades near $0.0030, up close to 19% over the prior 24 hours, according to the CoinMarketCap price page. Market cap sits around $50.5 million against a fully diluted valuation near $59.9 million. Circulating supply is roughly 16.69 billion CSPR out of a total supply near 19.81 billion, with no fixed maximum supply. 24-hour volume printed near $6 million, putting the volume-to-market-cap ratio above 11%, a healthy sign for an asset this size.
This snapshot matters for anyone running a short-term Casper price prediction. The 24-hour range spanned $0.002536 to $0.003257, and Casper's own Kraken trading promotion post shows that promotional pool as a live driver behind some of that volume. That is a wide band for one day, and it tells us conviction is still forming, not settled.
CSPR Technical Chart Analysis
On the daily CASPRUSDT chart, visible on a daily chart view like TradingView, price broke out of a descending channel that had capped every rally since early June. That channel held for weeks. Sellers controlled it the whole way down.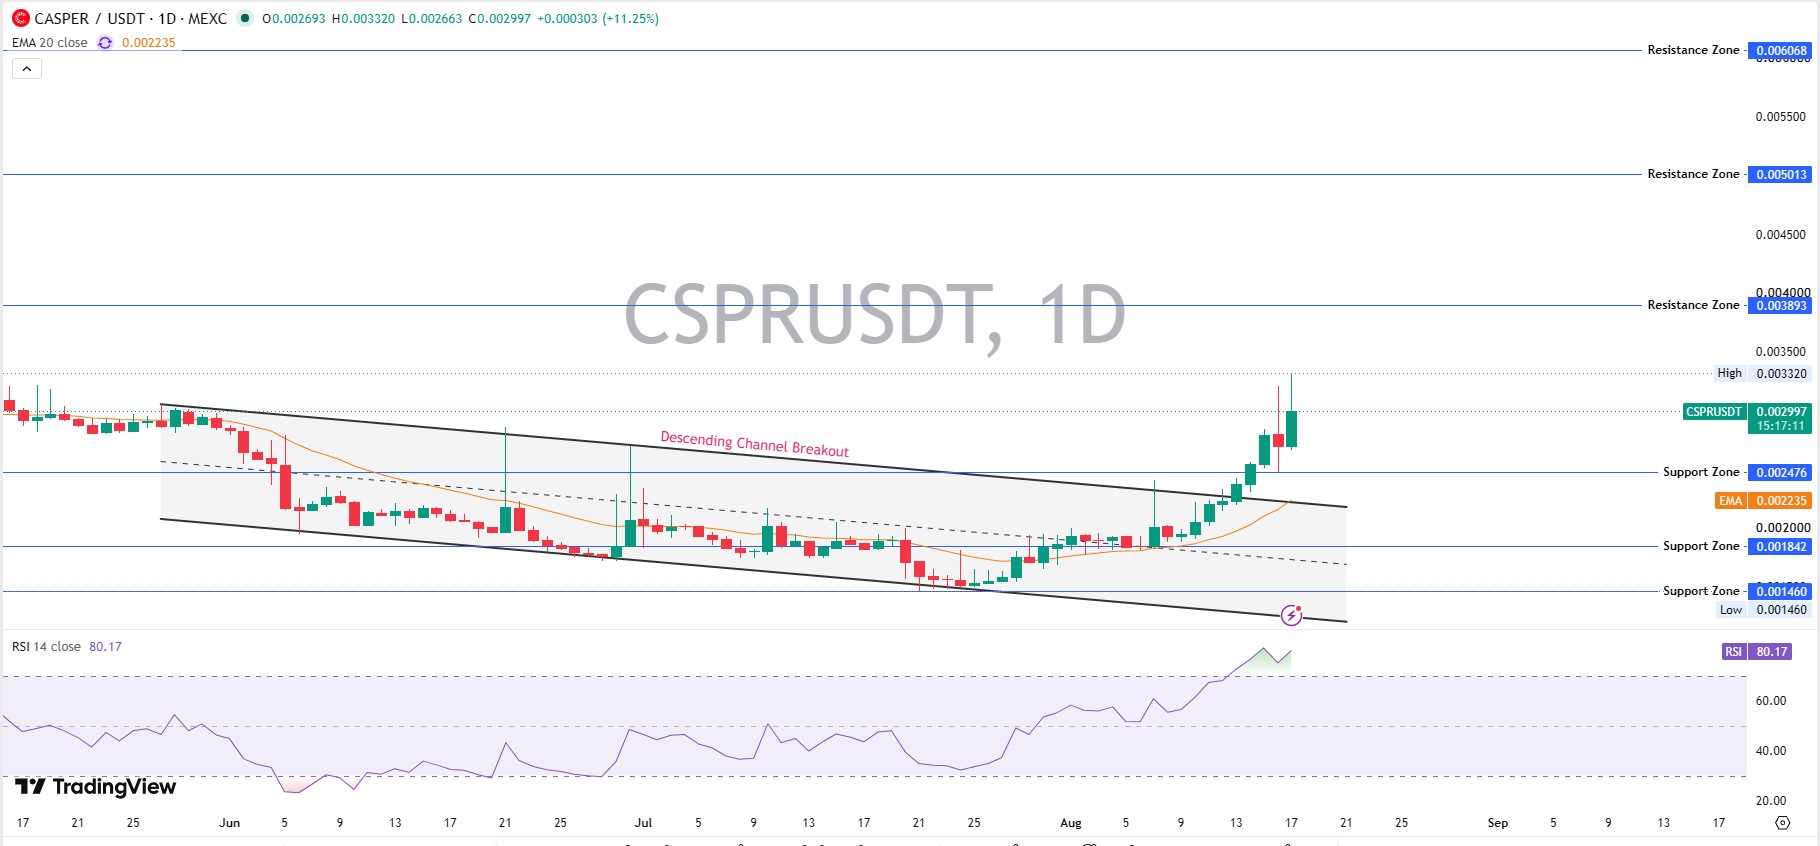
The breakout candle cleared the 20-day EMA near $0.002235 with real strength, not a weak wick through it. Price has closed above that EMA since, and that follow-through is what turns a breakout into a structure worth trusting, especially with broader Bitcoin price trends staying supportive of altcoins this month.
RSI reads 80.17 on the daily timeframe, deep into overbought territory. Readings this high usually precede a pause or a shallow pullback rather than an immediate collapse. But they rarely mean straight-line continuation either. A cool-off here would be normal, not bearish.
Volume backed the move too. The breakout candle traded well above the recent average, which is the kind of confirmation technical traders look for before trusting a channel break as genuine rather than a fakeout.
Support and resistance now define the near-term map. Immediate support sits near $0.002476; the old channel resistance has now flipped to support. Below that, $0.001842 is the next real floor, and $0.001460 marks the recent low. On the upside, resistance stacks at $0.003893, then $0.005013, then $0.006068.
Here's the thing: a pullback toward the breakout zone would still keep the broader structure intact, as long as buyers defend the former channel line near $0.002476. Lose that level on a daily close, and the breakout thesis weakens fast. Hold it, and the higher-low pattern building since early August stays alive, a pattern Casper itself referenced in a recent Casper Network update about its momentum. That is the level that matters most right now.
Casper Price Prediction: Bear, Base, and Bull Scenarios
| Timeframe | Bear Case | Base Case | Bull Case | Probability | Invalidation |
|---|---|---|---|---|---|
| 7 Days | $0.0020–$0.0025 | $0.0028–$0.0039 | $0.0039–$0.0050 | Bear 30% / Base 45% / Bull 25% | Daily close below $0.002476 |
| 30 Days | $0.00146–$0.00248 | $0.0039–$0.0050 | $0.0050–$0.0061 | Bear 30% / Base 45% / Bull 25% | Daily close below $0.001842 |
| Early 2027 | $0.0010–$0.0018 | $0.0050–$0.0080 | $0.0080–$0.0120 | Bear 25% / Base 45% / Bull 30% | Loss of the August higher-low structure / sustained break below $0.00146 |
This Casper price prediction framework treats the base case as the most probable outcome, not a promise. Worth checking a crypto events calendar too, since scheduled listings or unlock dates can shift these odds quickly. Nothing here guarantees returns.
Tokenomics and Liquidity
Casper's staking layer shows real depth. Roughly 11.49 billion CSPR, about 58% of total supply, sits bonded across 70 active validators, per cspr.live data, with staking yield near 10.34% annually. Most large wallets here look like validator and staking contracts rather than idle whales, which is a meaningfully different risk profile than a typical low-cap altcoin.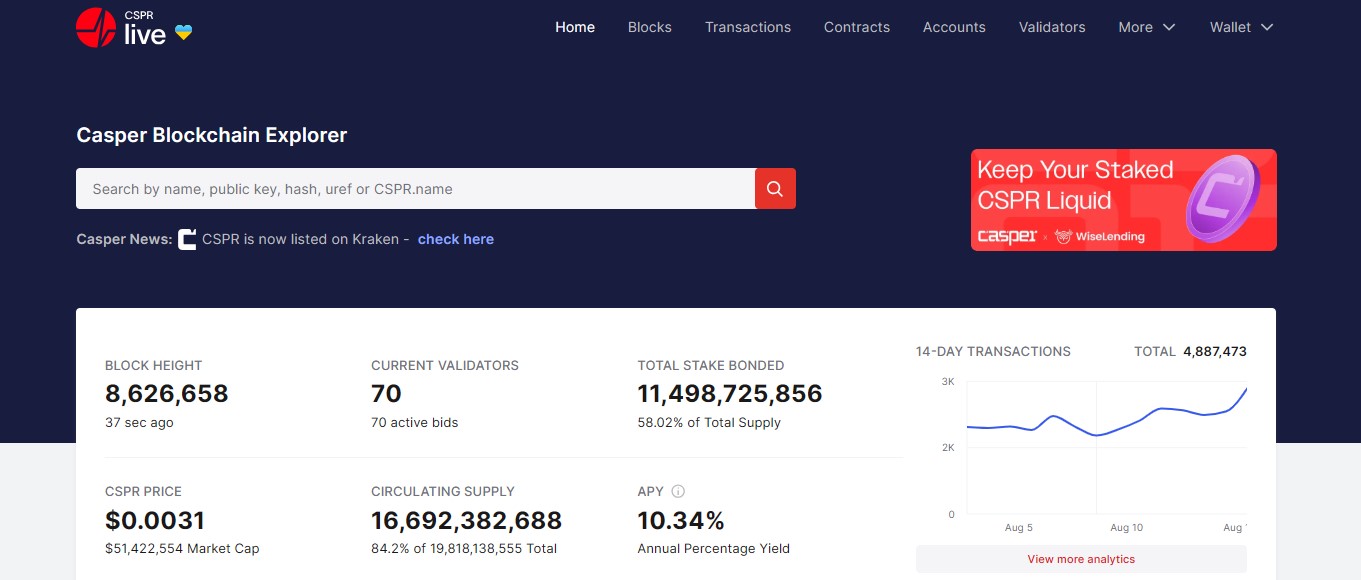
Liquidation data from Coinglass shows long-side liquidations near $141 across the past 24 hours, with almost no short liquidations, consistent with a fresh breakout catching late shorts off guard. Spot volume concentrates heavily on MEXC near $160K, with Kraken adding roughly $34.6K, a gap that should narrow as the new listing matures.
The 15.9 million CSPR Kraken pool works a lot like the reward pools seen across recent crypto airdrops, pulling in fresh wallets that stick around after the promotion ends.
Casper in the Wider Altcoin Market
CSPR trades as a mid-cap Layer 1 altcoin, not a memecoin, so its price action tends to track infrastructure narratives more than social momentum. Enterprise and payments partnerships, like the x402 Foundation seat, carry more weight here than they would for a purely speculative token. Compared with peer altcoins chasing the same AI-payments theme, Casper's staking ratio and validator count suggest a network with functioning security assumptions, something worth checking against any altcoin price prediction before sizing a position.
Risks That Could Break This Setup
Overbought RSI readings near 80 often cool off fast, and a sharp pullback toward $0.002 would not be unusual after a 19% daily move. Liquidity is still thin outside MEXC and Kraken, so slippage risk is real on larger orders.
Casper also carries an uncapped supply structure, which means long-term dilution is a standing risk factor, not a one-time event. Broader risk appetite matters too, and recent Fed policy news shows macro conditions can swing altcoin sentiment fast in either direction. None of this is investment advice.
Glossary
-
RSI (Relative Strength Index): A momentum indicator showing whether an asset is overbought or oversold.
-
EMA (Exponential Moving Average): A moving average weighted toward recent price data.
-
FDV (Fully Diluted Valuation): Market cap if the entire max supply were circulating.
-
Invalidation Level: The price point at which a forecast scenario is no longer considered valid.
Conclusion
This Casper price prediction rests on a real catalyst, not noise: a Kraken listing, a payments-standard partnership, and a technical breakout arriving together. The base case leans constructive, but RSI near 80 means a cooling-off period would not be surprising. Watch $0.002476 on the downside and $0.003893 on the upside. Everything else follows from there.
Disclaimer
This article is for informational purposes only and does not constitute financial, investment, or trading advice. Cryptocurrency markets are highly volatile, and prices can change significantly within short periods. Always conduct independent research and consult a licensed financial advisor before making any investment decisions. The data referenced was accurate as of August 17, 2026, 08:52 UTC, and may have changed since publication.
Also read:













.webp)








