BOME Price Forecast Today - What The Airdrop News Means Next


A meme coin nobody was watching yesterday just forced its way back into every trader's feed. That is basically what happened to Book of Meme in the last 24 hours, and the BOME price forecast conversation has suddenly gotten loud again.
Sudden spikes like this rarely move in a straight line, and this one has a very specific trigger behind it. So what actually pushed this token, and does it have legs? Keep that question in mind, because the answer is not as simple as "buy the pump."
Key Takeaways
BOME jumped 48.7% on a confirmed live airdrop announcement, not just speculation.
Trading currently sits near $0.001120, overbought on the 4H RSI at 79.77.
Immediate resistance: $0.0011850; key support: $0.0008770.
Whale concentration is high, but much of it sits in exchange wallets, not private hands.
Base case points toward consolidation before any move toward $0.0013 to $0.0017 in 30 days.
Book Of Meme Wakes Up: Why Everyone Is Suddenly Asking About BOME
There's a specific reason your feed is full of BOME charts right now. And it is not random hype. Something changed overnight, and traders noticed fast. We pulled up the order books ourselves, and the imbalance told its own story. This is the kind of move that either fades in days or marks a genuine trend shift. Which one will we get to?
Where BOME Trades Right Now: Latest Snapshot
As of August 20, 2026, 08:53 UTC, BOME trades near $0.001120, up roughly 48.7% on the day. Market cap sits around $77.16M, with 24-hour trading volume near $97.37M, a volume-to-market-cap ratio above 110%.
That's an extreme reading. The circulating supply is about 68.86 billion BOME against a matching total supply, and the holder count is near 90.8K wallets, per CoinMarketCap. Intraday range ran from a low of $0.0007465 to a high near $0.001156.
The Real Catalyst: A Live Airdrop, Not Just Sentiment
Basically, this is not another random meme coin candle. A live airdrop announcement for BOME on Solana triggered immediate speculative buying, and trading volume jumped roughly 141% in response. 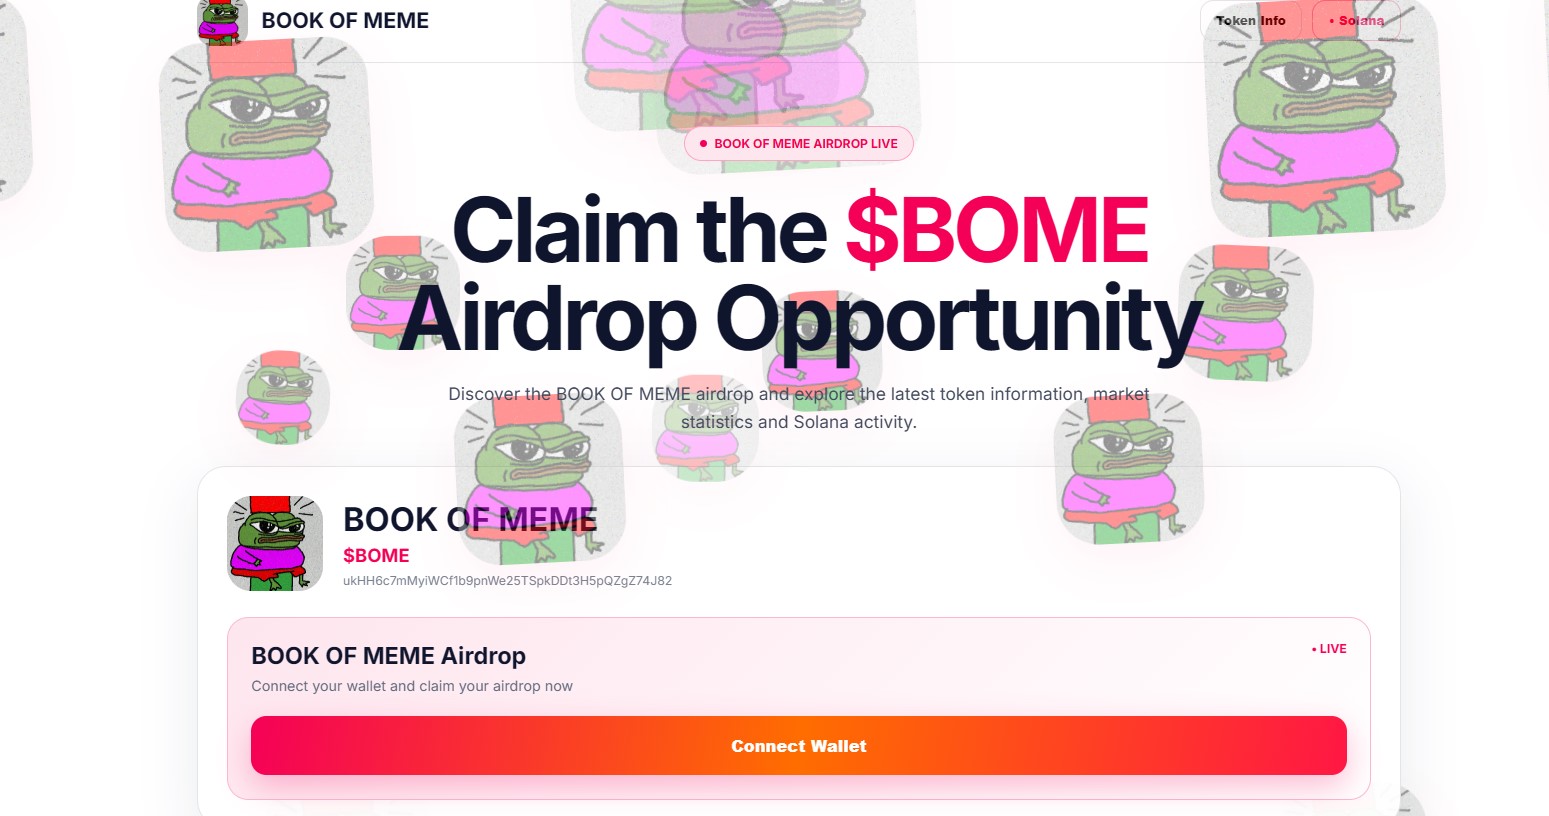
That's a confirmed, primary catalyst, not rumor. A secondary tailwind came from a broader Solana ecosystem rally and a general risk-on mood across crypto. Combine both, and you get a BOME crypto price prediction setup that's driven by real flow, not just chart momentum.
But volume alone does not guarantee a sustained BOME price forecast. And speculative volume tends to cool fast once the initial airdrop hype settles. Turns out, that's exactly the risk sitting under this rally.
Technical Chart Analysis: What The 4H Structure Is Showing
On the 4-hour trading view, BOME broke out of a multi-week ascending channel with a sharp green trading candle. The 20 EMA sits far below trading levels near $0.0008687, confirming the move is stretched above its short-term average.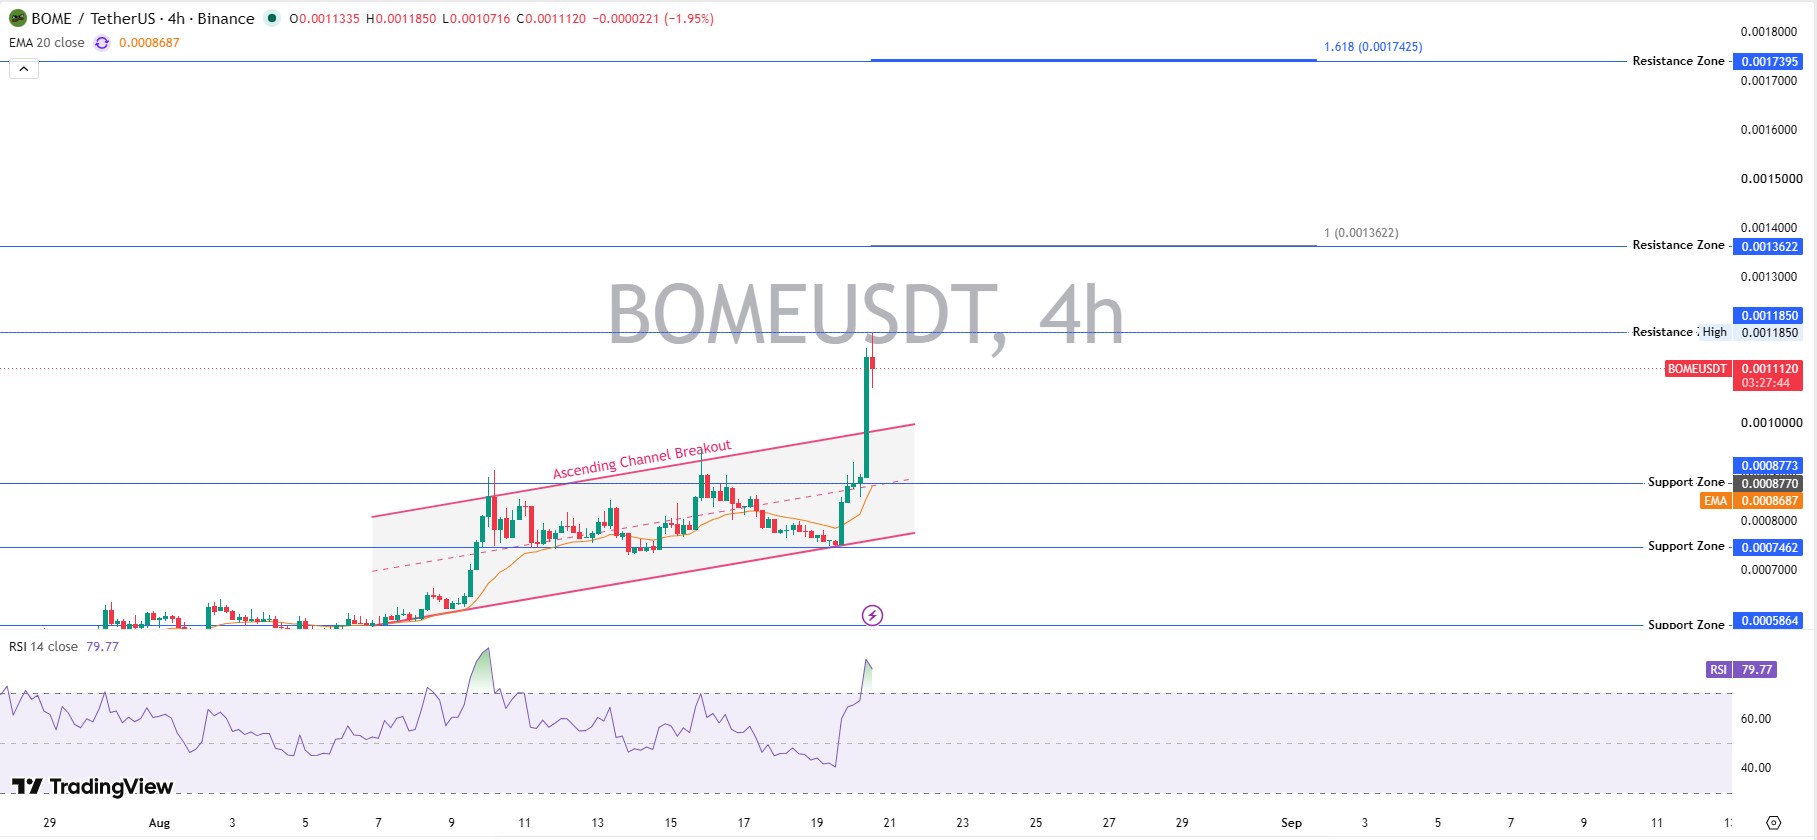
RSI(14) reads 79.77, deep into overbought territory, a level that historically precedes at least a short cooldown in trading. Immediate resistance sits near $0.0011850, the intraday high, with the next resistance zone at $0.0013622 and a stretch target near $0.0017395 based on Fibonacci extension. Support has formed near $0.0008770, with deeper support at $0.0007462 and $0.0005864.
This is overbought structure after a breakout: strong, but due for consolidation before the next leg, whichever direction that leg takes.
Whale And Holder Data: Who Actually Owns The Supply
Here's the thing most coverage skips. Top 10 wallets hold 70.68% of total supply, worth roughly $53.95M. But that figure needs context. Several of the largest wallets are exchange-tagged, including Binance and OKX cold wallets, not anonymous whales quietly accumulating them.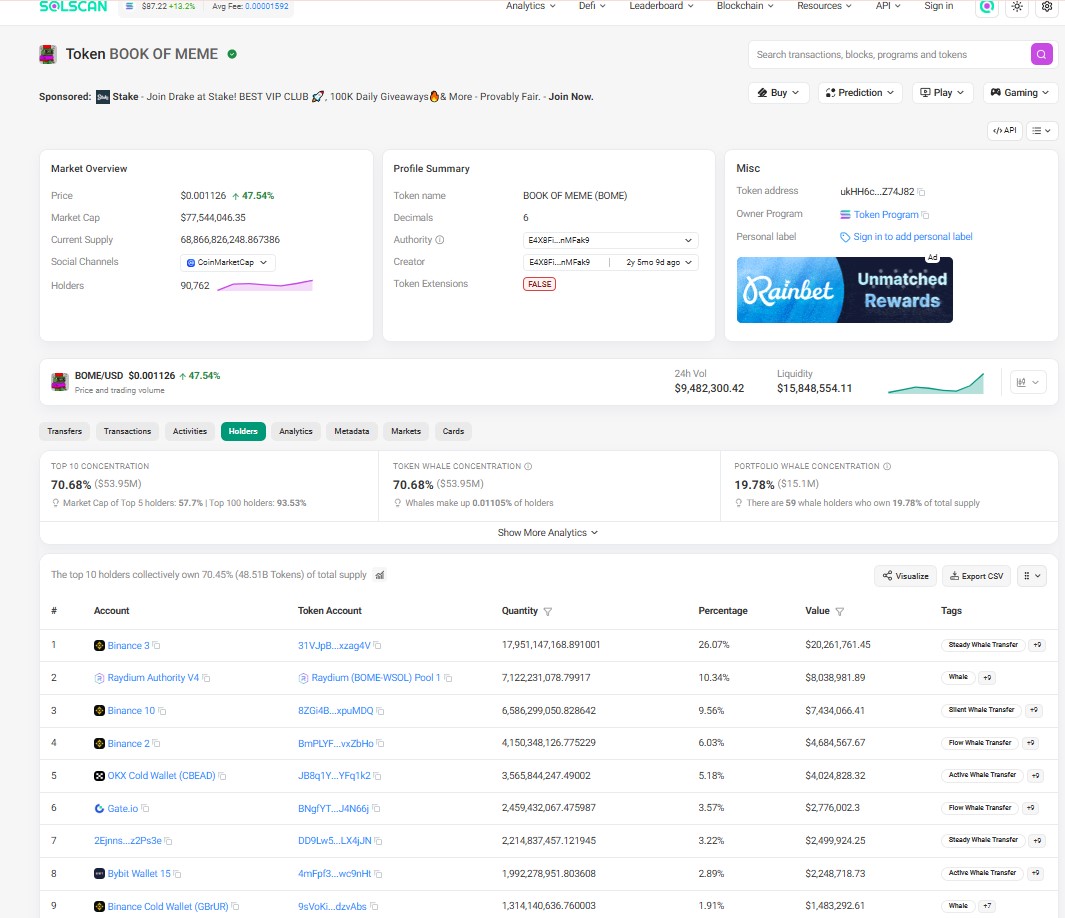
Per Solscan holder data, roughly 59 whale wallets control 19.78% of supply outright, separate from exchange custody. That distinction matters for a fair BOME price analysis, because exchange-held tokens behave differently than a private whale dumping into thin liquidity.
Liquidations And Market Positioning
Short positions took the bigger hit as BOME ripped higher. Twenty-four-hour liquidations total near $1.30M, split between $340.68K in longs and $955.55K in shorts, according to CoinGlass data.
Most trading volume flows through Binance near $123.14M, with OKX and Bybit rounding out the top venues. Heavy short liquidations often add fuel to a breakout, since forced buybacks push trading higher even without new organic demand.
Meme Coin Angle: Does BOME Still Fit The Narrative?
Book of Meme trades inside a crowded Solana meme coin field, and that context shapes any Book of Meme price prediction. Meme coin rallies tend to move in sector waves rather than isolated moves, and BOME's spike lines up with a broader Solana meme coin rally happening this week.
That is a tailwind. But it also means BOME's fate is partly tied to sector sentiment it does not control, not just its own fundamentals. Explore related coverage in the memecoin sector news hub.
Price Prediction: Bear, Base, And Bull Scenarios
Timeframe | Bear Case | Base Case | Bull Case | Probability | Invalidation |
7 Days | $0.00082 | $0.00105 | $0.00136 | Bear 30% / Base 45% / Bull 25% | Trading below $0.00075 support |
30 Days | $0.00068 | $0.00118 | $0.00174 | Bear 30% / Base 40% / Bull 30% | Weekly trading close under $0.00059 |
Early 2027 | $0.00045 | $0.00160 | $0.00280 | Bear 25% / Base 45% / Bull 30% | Loss of $0.00059 zone with no recovery |
Key Risks Behind This BOME Price Forecast
Volatility here is extreme, and overbought RSI raises pullback odds near-term. Liquidity, at roughly $15.85M against a $77M market cap, is thin enough that large exits could move trading fast.
Airdrop-driven volume historically fades within one to two weeks. And meme coin sentiment can flip without warning. None of that erases the bullish setup, but it does mean position sizing matters more than usual here.
Disclaimer
This article is for informational purposes only and does not constitute financial, investment, or trading advice. Cryptocurrency markets, especially meme coins, are highly volatile and speculative. Prices can move sharply in either direction. Always do your own research and consult a licensed financial advisor before making any investment decisions.
Also read:








.webp)








