BNB Price Prediction: $BNB Could Launch a Fresh Bullish Rally


$BNB started out in 2017 as the native token of the Binance exchange, offering trading fee discounts, and it has since grown into the backbone of its own blockchain ecosystem while remaining tied closely to Binance's success.
It's currently trading around $629.34, up close to 5% on the day, with a market cap of $83.803B that makes it the 4th largest cryptocurrency in the market.
This BNB price prediction is built around which side of that channel gives way first.
Live Market Data
Metric | Value |
Price | $629.34 |
24h Change | +4.6% |
24h Range | $601.28 - $635.85 |
$83.803B | |
Fully Diluted Valuation | $83.803B |
24h Trading Volume | $1.387B |
Circulating Supply | 133.163M |
Total Supply | 133.163M |
Max Supply | 200M |
Source: $BNB market cap data taken from Coingecko, data as of Aug 20, 2026. Figures may vary slightly across other tracking websites.
Liquidation Snapshot
BNB's move higher over the past 24 hours came with $7.28M in total liquidations, and short sellers took the much bigger hit at $6.43M against $847.06K in long liquidations, suggesting a good number of traders were caught leaning short into the rally. 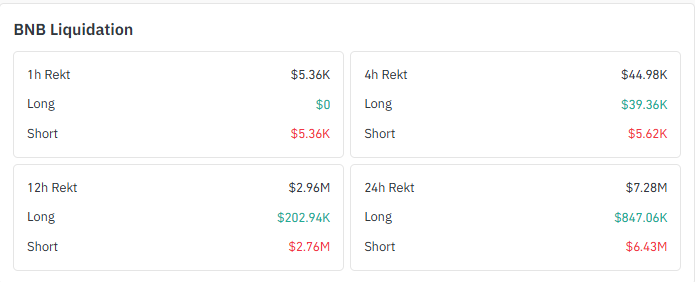
Source: Liquidation Data Taken From Coinglass.
The 12-hour window shows the same lopsided pattern, with $2.76M in short liquidations against $202.94K in longs.
The shorter windows tell a slightly different story, though, with the 4-hour window showing $39.36K in long liquidations against just $5.62K in shorts, and the 1-hour window showing only shorts getting liquidated at $5.36K.
Exchange Volume
Binance leads BNB futures activity by a wide margin with $718.33M in volume, followed by OKX at $104.02M and LBank at $90.25M. 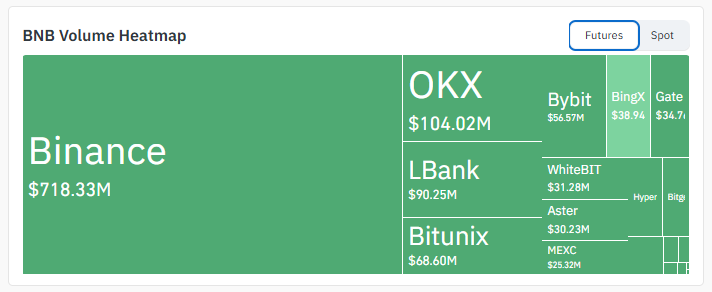
Source: Volume Heatmap Data Taken From Coinglass.
Bitunix, Bybit, and BingX round out the next tier, while Gate, WhiteBIT, Aster, and MEXC contribute smaller but still meaningful slices of the total.
$BNB News Today
Social sentiment around $BNB has picked up on the back of some standout real-world asset numbers. 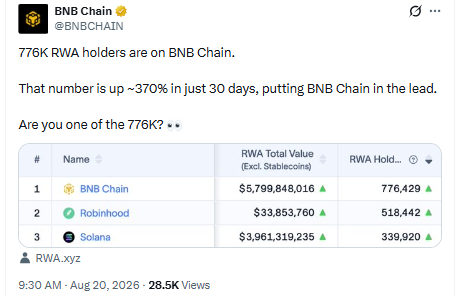
Source: Data Taken From @BNBCHAIN, X Account.
A widely followed account tied to the network highlighted that the number of RWA holders has climbed roughly 370% in just 30 days, putting the chain ahead of other major platforms by both total RWA value and holder count.
That kind of growth in tokenized real-world assets adds a fundamental tailwind alongside the technical setup, reinforcing the bullish tone seen in the recent liquidation data for this BNB price prediction.
Technical Analysis
Daily Chart Analysis for $BNB Price Prediction
$BNB has been climbing steadily inside an ascending channel on the daily chart, with a rising lower boundary supporting price and a rising upper boundary capping it, based on TradingView data. 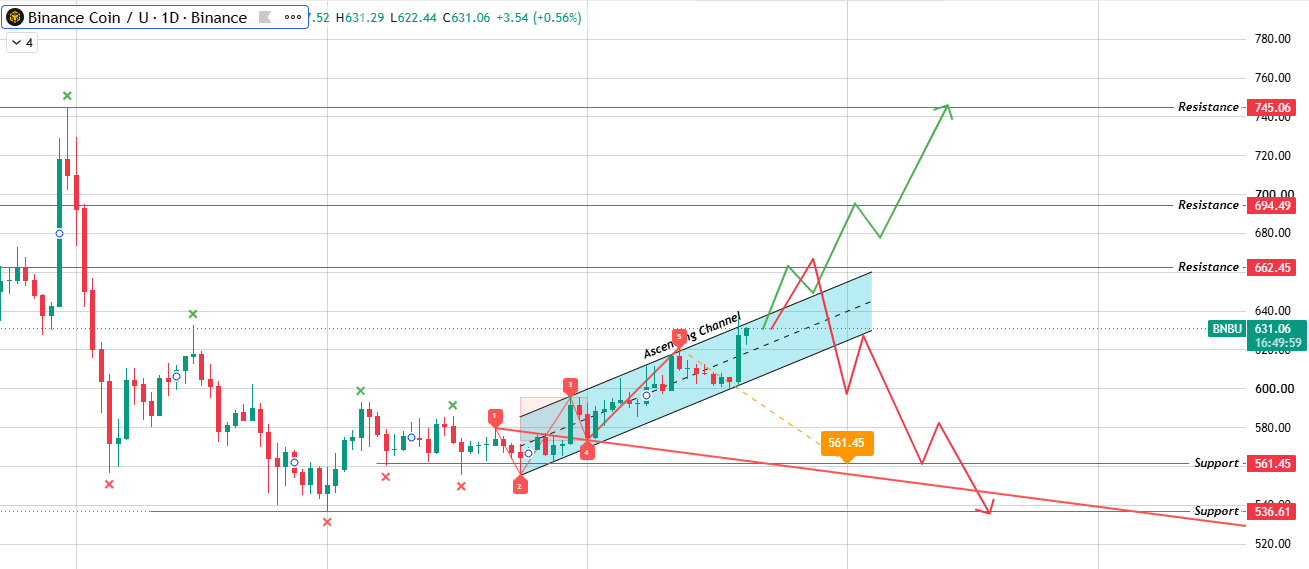
Source: Chart Taken From TradingView.
Layered on top of that channel is a Wolfe Wave structure, a five-point pattern that traders watch for its projected level line.
Here, that level sits at $561.45, meaning if the price breaks below the channel's lower boundary, the Wolfe Wave setup points toward that level as the likely downside objective.
On the flip side, if the price instead breaks above the upper boundary of the channel, the path opens toward $662.45 first, then $694.49 and $745.06 further out.
With the price currently sitting mid-channel, this BNB price prediction depends on which boundary gets tested and broken first.
Support and Resistance Levels
Level Type | Price |
Resistance 3 | $745.06 |
Resistance 2 | $694.49 |
Resistance 1 | $662.45 |
Immediate Price Reference | $631.06 |
First Support | $561.45 |
Structural Floor | $536.61 |
These levels for this BNB price prediction are pulled directly off the daily chart, from the top resistance right down to the structural floor.
Bull, Base, and Bear Case
Scenario | Price level | Invalidation |
Bull | $662.45 - $745.06 | Fails to close above the channel's upper boundary on strong volume |
Base | $561.45 - $662.45 | Price keeps oscillating inside the channel without a decisive break. |
Bear | $536.61 or lower | The lower boundary of the channel breaks, and the Wolfe Wave level at $561.45 is tagged and lost |
These three scenarios anchor this BNB price prediction, weighted by which boundary of the ascending channel gives way first.
Key Takeaways
BNB is trading inside an ascending channel on the daily chart, with a Wolfe Wave pattern pointing to a key downside level if the lower boundary breaks.
Current price sits at $629.34, up 4.6% over the past 24 hours, inside a 24-hour range of $601.28 to $635.85.
A break above the channel's upper boundary opens the path toward $662.45, then $694.49 and $745.06.
A break below the lower boundary instead points toward $561.45, the level flagged by the Wolfe Wave structure, with $536.61 as a deeper floor.
Liquidation data over the past 24 hours shows shorts absorbing the bulk of the damage, a sign the recent move caught sellers off guard.
Glossary
Ascending Channel: A chart pattern formed by two parallel upward-sloping trendlines, with price bouncing between a rising support line and a rising resistance line.
Wolfe Wave: A five-point chart pattern traders use to identify potential trend reversals and project a price level based on the pattern's internal geometry.
Breakout: A price move above (or below) a defined chart boundary, often signaling a potential trend shift.
Liquidation: The forced closure of a leveraged trading position when losses exceed the trader's margin.
Resistance: A price level where selling pressure has historically been strong enough to stop further upward movement.
Support: A price level where buying pressure has historically been strong enough to halt further downward movement.
Market Cap: The total value of all circulating coins, calculated as price multiplied by circulating supply.
Methodology
All price levels, the ascending channel structure, and the Wolfe Wave level referenced in this BNB price prediction are derived directly from the 1D BNB/USDT chart on TradingView, cross-checked against live market data and Coinglass liquidation figures at the time of writing. No price levels are extrapolated beyond what the chart structure supports.
Disclaimer: This article is for informational purposes only and does not constitute financial, investment, or trading advice. Cryptocurrency markets are highly volatile, and prices can change rapidly. Always conduct your own research and consult a licensed financial advisor before making investment decisions.








.webp)








