Can Ethereum Break $2,550, Rally to $3,000 as Tom Lee Buys More ETH?


Ethereum is trading at $2,460 today, and traders are watching one thing closely. Can the coin finally clear the $2,500 to $2,550 wall that has capped it for months?
The move comes after a rough 24 hours. ETH is down 1.82% on the day, slipping from a weekly high near $2,533. Still, the bigger picture looks steady rather than shaky.
Zoom out to the weekly chart and the coin looks like it spent 2026 quietly rebuilding. It fell to the $1,500 to $1,600 zone earlier in the year, then clawed its way back above every major moving average.
What Is Ethereum's Price Doing Right Now?
At the time of writing, ETH sits at $2,460.76, down $45.6 on the day. The 24-hour trading range stretched between roughly $2,414 and $2,533, based on Binance weekly data.
Futures volume over the past 24 hours came in at $44.20 billion, down 35.84%. Open interest fell 1.79% to $32.43 billion. Spot volume was lighter at $2.54 billion, while its market cap stands at $297.30 billion.
That drop in both volume and open interest usually means one thing. Traders are closing positions rather than opening new ones, a sign of cooling leverage after a sharp run higher.
Why Are Long Traders Getting Liquidated?
The past 24 hours saw $74.25 million in total liquidations across the market. Long positions took the bigger hit, losing $61.65 million, compared to $12.60 million in short liquidations.
That pattern held across shorter windows too. In the past hour, longs lost $515.58K against just $181.58K for shorts. Over four hours, long liquidations reached $690.81K.
This tells a simple story. Bulls who piled in expecting an immediate breakout got squeezed when price pulled back from the $2,500 zone. The 24-hour long/short ratio sits at 0.9646, close to balanced but leaning slightly toward shorts.
Options open interest, meanwhile, rose 2.56% to $7.49 billion even as options volume fell 8.67%. That suggests some traders are holding onto positions rather than trading actively, possibly waiting for a clearer signal.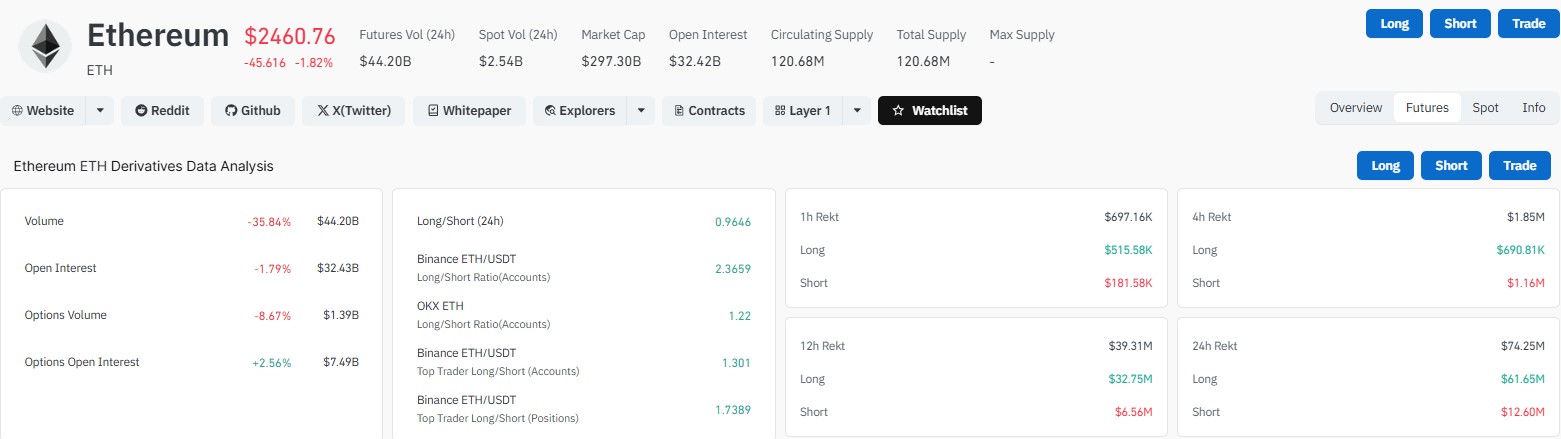
Is the Wyckoff Accumulation Pattern Playing Out?
Chart watchers on social media, including trader Merlijn The Trader, have pointed to a textbook Wyckoff accumulation structure forming on the ETH chart through 2026.
The pattern includes a buying climax, an automatic rally, a secondary test, a spring low near $1,505, and now what some call a sign-of-strength print near $2,485.
According to this view, the structure suggests accumulation has wrapped up and Phase D, the markup stage, has begun. The entry zone flagged sits between $2,180 and $2,340, with an upside target of $3,600 and a level near $1,900 that would invalidate the setup.
It is worth remembering that Wyckoff analysis is one lens among many. Chart patterns describe possible outcomes, not certainties, and price can just as easily fail to follow the script.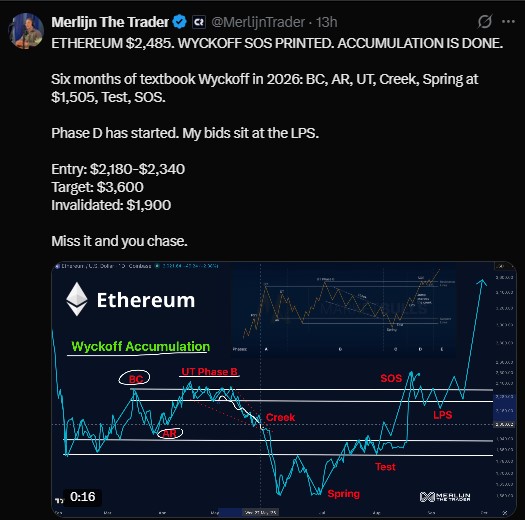
Where Are Ethereum's Key Support and Resistance Levels?
The weekly chart shows ETH trading above its 20-week and 50-week exponential moving averages, at $2,079.76 and $2,372.98, respectively. The 100-week EMA sits higher at $2,556.92, right inside the resistance band traders are watching.
Level Type | Price Zone | Significance |
Key Resistance | $2,550 - $2,600 | 100-week EMA and prior structure |
Next Target | $2,800 | First breakout objective |
Extended Target | $3,000 - $3,250 | Bullish continuation zone |
Major Target | $3,750 - $4,000 | If $3,250 clears with volume |
First Support | $2,370 - $2,450 | Near 50-week EMA |
Key Support | $2,080 | 20-week EMA |
Deeper Support | $1,600 - $1,800 | Correction floor if $2,080 breaks |
The 14-period RSI on the weekly chart reads 58.88, up from 40.81 a week earlier. That is a healthy reading, showing improving momentum without tipping into overbought territory.
Are Institutions Still Buying Ethereum?
Fundstrat's Tom Lee, through his firm Bitmine, added another 20,000 ETH worth roughly $48.89 million, purchased from Kraken according to blockchain tracker Lookonchain. That kind of buying has become a regular feature of this cycle.
Spot ETH ETFs are also having their strongest month in a year. Data from SoSoValue shows $1.24 billion in net inflows during August 2026 so far, the highest since August 2025.
On a single day this week, ETH ETFs pulled in $179.80 million, with BlackRock leading at $146.44 million. Total ETF net assets now sit at $14.88 billion, or about 5.06% of the total market cap.
Steady ETF demand alongside large wallet purchases points to institutional appetite that has not slowed down, even as the spot price consolidates below resistance.
What Could Push Ethereum Toward $3,000?
A weekly close above $2,550 is the level most chart watchers are focused on. Clearing that zone on strong volume would open the door toward $2,800, and from there $3,000 to $3,250 becomes the next logical stop.
A move beyond $3,250 would mark a firmer break from the multi-month range and could bring $3,750 to $4,000 into view over time. None of this is guaranteed, and weekly closes matter far more than short-term wicks.
On the downside, losing the $2,080 support on a weekly close would weaken the bullish case. That could open a path back toward the $1,600 to $1,800 zone, where buyers stepped in earlier this year.
The Bottom Line
ETH is at a decision point. Price sits just below a resistance band that has held since spring, while momentum indicators and institutional flows both lean bullish.
The next one or two weekly candles may decide whether ETH pushes toward $3,000 or spends more time building a base under $2,550. Traders should watch the close, not the wick.
Disclaimer
This article is for informational purposes only and does not constitute financial, investment, or trading advice. Past performance and chart patterns, including Wyckoff analysis, do not guarantee future results. Always do your own research and consult a licensed financial advisor before making any investment decisions.
Also read:

















