Cardano Price Prediction: Energy News Meets ADA Breakout Setup


Cardano price prediction is drawing attention again as ADA finds itself boxed inside a pattern that has been quietly tightening for days.
The kind of structure ADA is sitting in right now usually resolves with a real move, not a slow drift, and the market seems to know it.
Price has been squeezed into a narrowing range long enough that a decisive break in either direction looks increasingly likely, and the next few candles could end up defining ADA sentiment heading into September. Here is the full picture.
Cardano Price Today: Live Data and 24-Hour Change
ADA is trading at $0.2008 at the time of writing, down 4.24 percent, a drop of $0.008891 over the past 24 hours.
Futures volume over the same period stands at $445.26 million while spot volume sits at $79.40 million, showing that leveraged trading is dominating activity right now.
Market cap is holding at $7.37 billion, open interest is at $454.04 million, and circulating supply is 36.71 billion ADA out of a total supply of 44.99 billion and a max supply capped at 45.00 billion.
Source: CoinGlass, August 29, 2026.
Cardano Latest News and Catalyst
Alongside the price action, Cardano is getting some attention on the fundamentals side too.
According to a post from Cardanians, ADA is estimated to be roughly 75,300 times more energy efficient than Bitcoin, a figure the account attributes to data from Cexplorer.
The post credits this efficiency to Cardano's Ouroboros proof-of-stake mechanism.
Sustainability narratives like this do not usually move price in the short term, but they continue to feed into Cardano's long-running positioning as one of the more energy-conscious major networks in crypto.
Source: Cardanians on X, August 28, 2026.
Cardano Liquidation Data and Market Positioning
Liquidation flow over the past day leans heavily toward longs, which fits with the drop ADA has taken.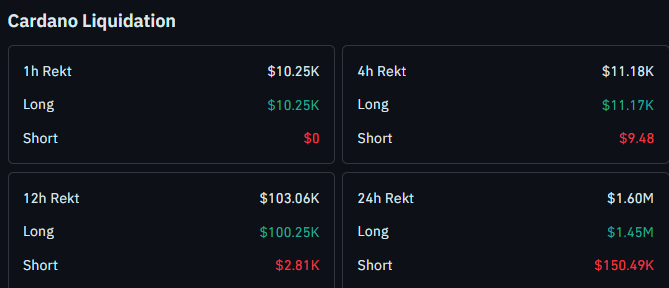
Over the last 24 hours, $1.60M in positions were liquidated, with $1.45M of that coming from longs against $150.49K from shorts.
The 12-hour window shows $103.06K total rekt, $100.25K of it from longs versus just $2.81K from shorts.
In the most recent 4-hour window, $11.18K was liquidated overall, split between $11.17K in longs and a small $9.48 from shorts, showing that sellers have been firmly in control through this latest leg down.
Source: CoinGlass liquidation data, August 29, 2026.
Quick Take
CMP: $0.2006 on the 4-hour Binance perpetual chart
Bullish trigger: 4-hour close above $0.2118 with sustained follow-through needed to confirm wedge breakout
Bullish continuation levels: $0.2592, then $0.2885
Bearish trigger: 4-hour close below $0.1858
Bearish target on breakdown: $0.1709
Data timestamp: August 29, 2026, 10:15 UTC+5:30
Risk note: ADA is compressed inside a falling wedge, and moving out of this kind of structure can happen fast once a level breaks on a closing basis, so confirmation matters more than a single wick
Cardano Technical Forecast August 2026
The 4-hour ADA/USDT perpetual chart on Binance shows the price currently trading inside a falling wedge, a pattern that has been forming since the price pulled back from its late August highs.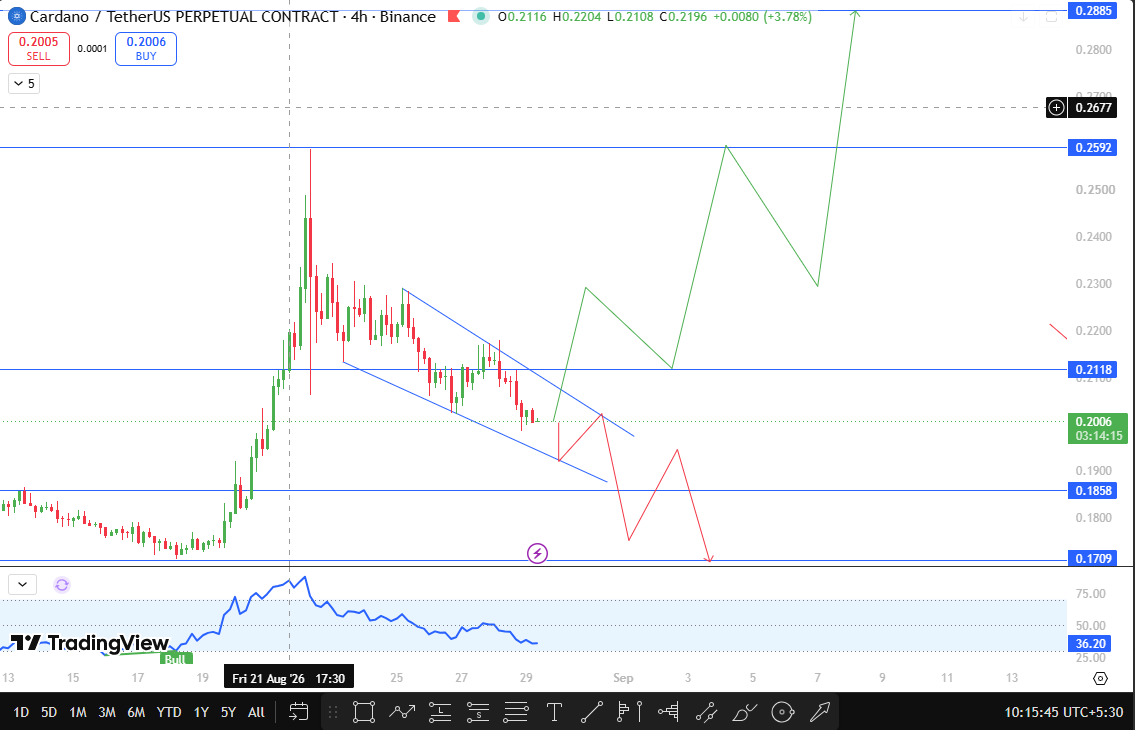
Within this wedge, ADA has been carving out lower highs and lower lows along two converging trendlines, and that kind of compression tends to build up pressure for a sharper move once it finally resolves.
If ADA manages to close above $0.2118 on the 4-hour chart and holds there, that would count as the first real sign the wedge is breaking to the upside.
Sustained strength beyond that level opens the path toward $0.2592, and if buyers keep pushing, $0.2885 becomes the next level in play.
Both of these are marked from recent swing highs, so some resistance around those zones would not be surprising.
On the downside, if ADA fails to hold and closes below $0.1858 on the 4-hour timeframe, that would confirm the wedge is breaking the other way.
In that case, the next support to watch drops to $0.1709, a level defined by a recent swing low.
Given how tight this wedge has become, either break is likely to come with some speed behind it, so this is a setup worth watching closely over the next several sessions.
Source: TradingView, ADA/USDT Perpetual, 4-hour chart, Binance, August 29, 2026.
ADA Support and Resistance Levels
Level Type | Price | Note |
Resistance 2 | $0.2885 | Recent swing high |
Resistance 1 | $0.2592 | Recent swing high |
Wedge Breakout Level | $0.2118 | Confirmation level for upside break |
Current Price | $0.2006 | CMP on 4-hour chart |
Wedge Breakdown Level | $0.1858 | Confirmation level for downside break |
Support 1 | $0.1709 | Recent swing low |
Bull, Base, and Bear Case for ADA
In the bull case, ADA breaks and closes above $0.2118, sustains the move, and works its way toward $0.2592 with $0.2885 as the extended target if momentum keeps building.
The base case has $ADA continuing to chop inside the wedge for a bit longer, unable to close cleanly beyond either boundary while the market waits for a stronger signal.
In the bear case, $ADA closes below $0.1858, confirming the wedge breaks lower, and price heads toward a retest of $0.1709.
Risks to This Cardano Price Prediction
The main risk here is a false breakout of the wedge in either direction, something falling wedges are prone to, especially on lower timeframes like the 4-hour chart.
Broader market conditions, including sudden moves in Bitcoin or Ethereum, could easily override this setup regardless of what ADA's own chart is showing. This analysis is based purely on the current chart structure and available data, and conditions in crypto markets can shift quickly.
Glossary
CMP: Current Market Price, the price at which an asset is trading right now.
Falling Wedge: A chart pattern formed by two converging downward-sloping trendlines, often associated with a potential reversal or breakout.
Open Interest: The total number of outstanding derivative contracts that have not been settled.
Liquidation: The forced closing of a leveraged position when losses exceed the trader's available margin.
Disclaimer
This article is for informational purposes only and should not be considered financial advice. Cryptocurrency markets are highly volatile, and readers should conduct their own research before making any investment decisions.
Also read:

















