Cash Cat Price Prediction 2026: Can $CASHCAT Hold $0.10?


A brand new memecoin just ripped sixty percent higher in a single session, and the chart tells a stranger story than the headline number does. Short sellers got caught leaning wrong. Is this the start of something that sticks, or just a squeeze that fades once leverage clears out?
Why CASHCAT Just Broke Out
This Cash Cat price prediction starts with the number everyone's watching. $CASHCAT trades near $0.0691, up over 62% in 24 hours, per CoinMarketCap. Volume hit $23.6M, up more than 342%. That's real money moving, not a thin-book wick.
Turns out, the daily chart had been carving a falling wedge since mid-July, and price cleared the upper trendline this week. Per CASHCAT liquidation data on CoinGlass, 24-hour liquidations hit $385.98K, nearly all from shorts.
A squeeze did the rest, echoing the Robinhood surge coverage from days earlier.
$CASHCAT Technical Analysis: Hourly Chart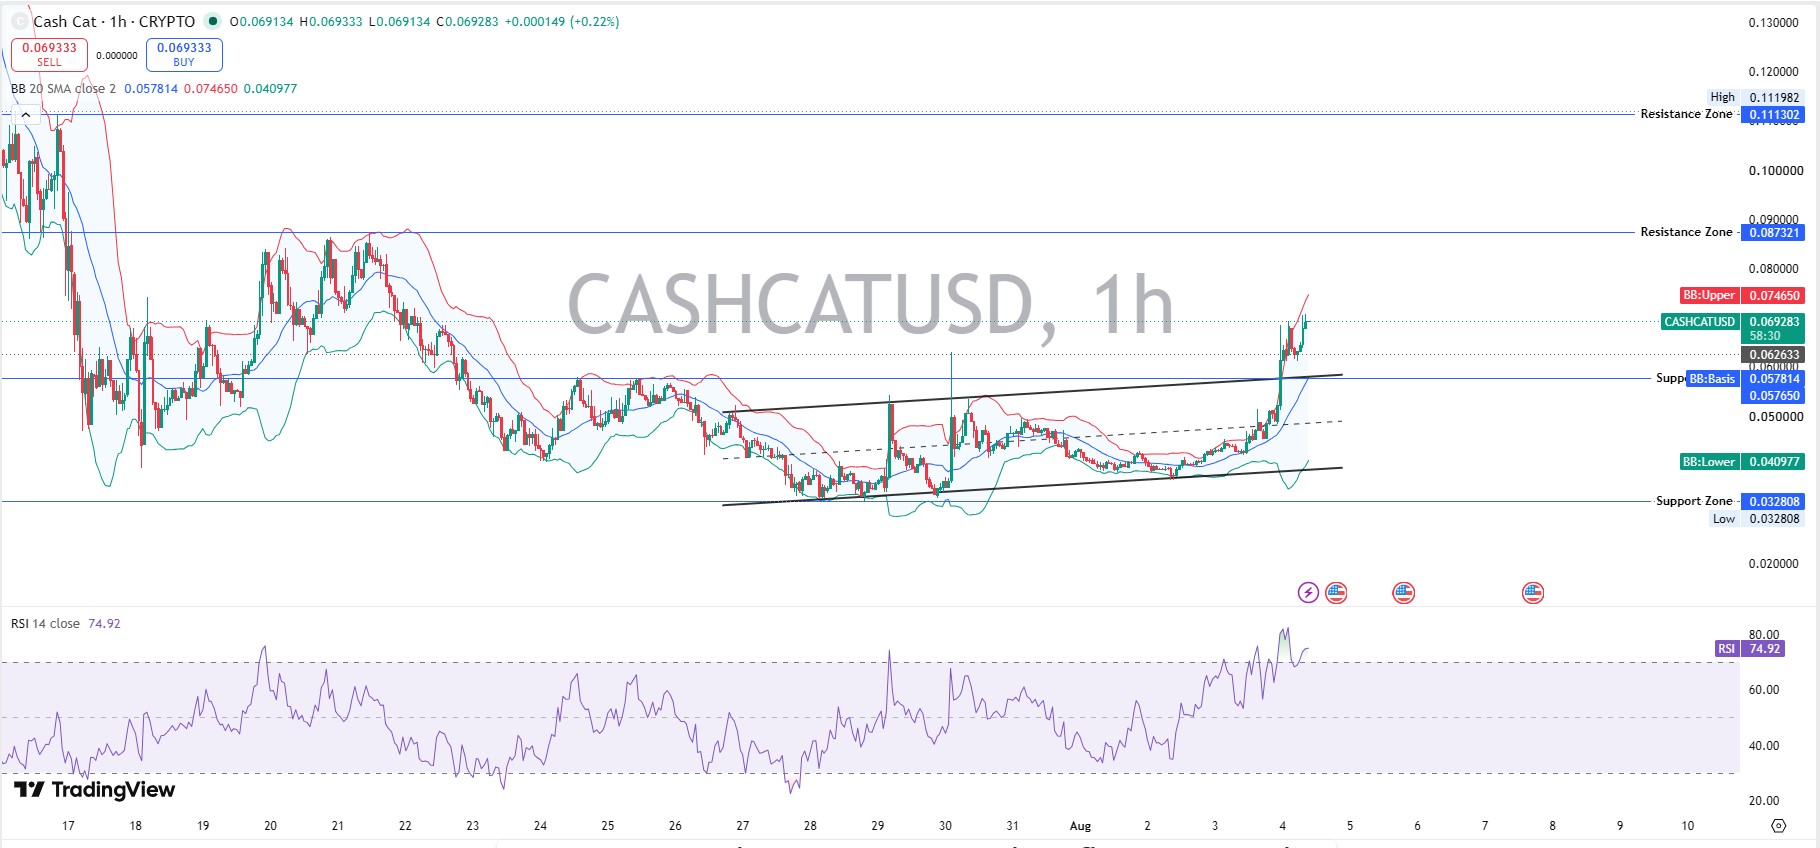
Zoom into the 1-hour chart, and it gets hotter. Price sat at $0.069283, with RSI at 74.92, in overbought territory. An ascending channel built since July 27 broke out on a sharp green candle. Resistance shows at $0.087321, then $0.111302. Support runs $0.057814, then $0.032808.
Here's the thing: overbought hourly RSI doesn't kill a rally alone. But it raises odds of a pullback first.
CASHCAT Technical Analysis: Daily Chart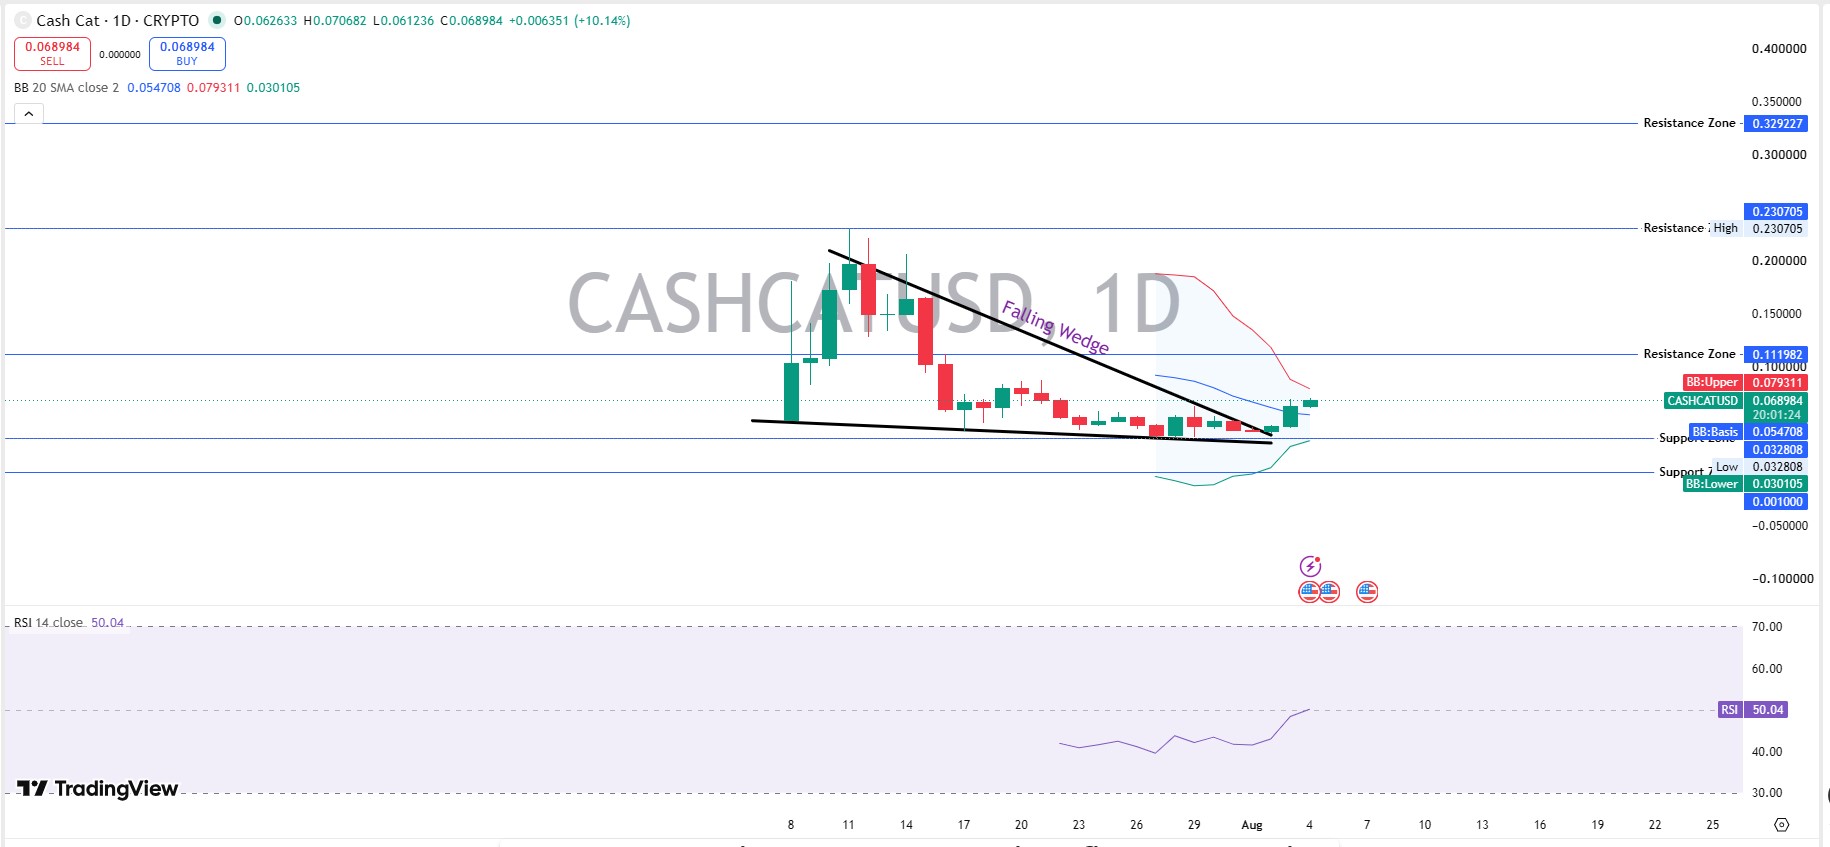
Per CASHCATUSD on TradingView, $CASHCAT closed at $0.068984, up 10.14% for the candle, with the falling wedge broken upward. Resistance stacks at $0.079311, then $0.111982, then $0.230705, then $0.329227. Support sits at $0.054708, then $0.032808. Daily RSI reads 50.04, still neutral. A close above $0.111982 would open the door toward the July highs.
CASHCAT Support And Resistance Levels
Immediate support: $0.054708, then $0.032808, mapped fully in the support and resistance breakdown.
Immediate resistance: $0.079311, then $0.111982, then $0.230705.
CASHCAT Price Prediction: Scenarios By Timeframe
Timeframe | Bull Case | Base Case | Bear Case |
24H | Holds above $0.069, tests $0.0793 | Chops $0.06-$0.07 | Slips under $0.0547 |
7D | Close above $0.1120 opens $0.2307 | Range-bound under resistance | Retests $0.0328 |
2026 | Retests ATH near $0.2252 | Drifts $0.05-$0.11 | Breaks $0.0328, new lows |
Invalidation for the bullish case is a daily close under $0.0547.
Tokenomics And On-Chain Holder Data
Cash Cat's contract sits at 0x020bfC650A365f8BB26819deAAbF3E21291018b4, fixed at 1B CASHCAT. Circulating supply equals total supply, so there's no vesting overhang.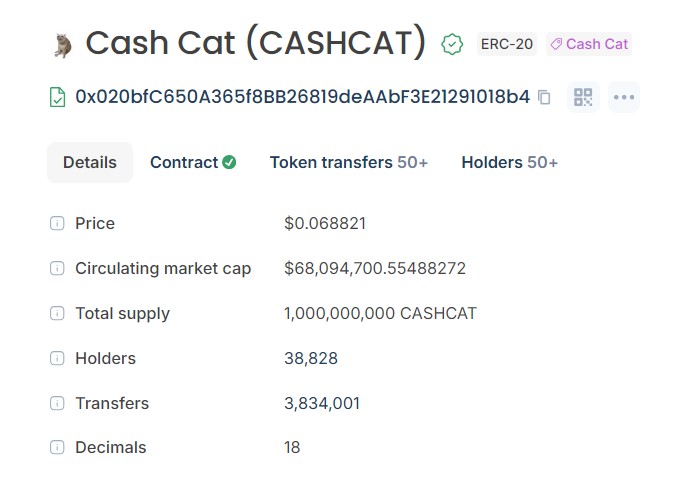
Per on-chain holder data, the token counts 38,828 holders and 3,834,001 transfers. CertiK rates it 3.5 out of 5. We don't have a full whale-tier breakdown from permitted sources yet, so we're not guessing.
Liquidity-to-market-cap runs 10.18%, per Cash Cat market data on CoinMarketCap.
Liquidations And Exchange Volume
Futures activity concentrates on Hyperliquid at $13.32M, with LBank near $1.56M, Aster around $1.41M, and BingX near $780.34K.
That's real derivatives interest for a month-old token, tracked further in the new exchange listings piece.
CASHCAT And The Memecoin Narrative
$CASHCAT isn't chasing utility headlines. It trades on momentum, listings, and community push, not roadmaps. A 62% day next to an all-time high still 69.47% away doesn't automatically mean a trend reversal, a point the Robinhood Chain rally recap made too.
$CASHCAT Market Outlook: Risks To Watch
An asset up 62% in a day can give it back just as fast. That's how memecoins work.
A break below $0.0328 puts $CASHCAT near levels flagged in the previous CASHCAT crash coverage.
Methodology: Chart levels came from CASHCATUSD hourly and daily charts on TradingView (RSI-14, 20-period Bollinger Bands), captured August 4, 2026, around 09:30 UTC. Price and volume data came from CoinMarketCap around 09:15 UTC. Holder data came from the RobinHood Chain explorer. Liquidation data came from CoinGlass around 09:40 UTC.
Disclaimer: This is speculative market commentary, not financial advice. Crypto assets are volatile and can lose most of their value. Verify live figures before trading.


















