Cash Cat Price Prediction: Can Ourbit and KCEX Boost CASHCAT?


Cash Cat price prediction is suddenly the question every crypto trader on X is asking after CASHCAT ripped higher this week. A coin barely anyone had heard of ten days ago is now sitting near its all-time high, and the chart tells a story that's hard to ignore. Is this the start of something bigger or just another meme coin flash in the pan?
The Story Behind Today's Sudden Cash Cat Price Jump
A small cat-themed token just did something most coins never manage. It went from under a cent to a genuine talking point in the span of nine days, and that kind of move tends to pull in attention fast.
Turns out, the trigger wasn't some random pump group. It was tied to real exchange activity and a chain getting a lot of eyeballs lately.
Traders who caught it early are sitting on gains most people only dream about. And those who missed it are asking the obvious question.
Does Cash Cat still have room left, or has the easy money already been made?
What Is Cash Cat And Why Is It On Robinhood Chain
Cash Cat, ticker CASHCAT, is an ERC-20 style token built on Robinhood Chain. Basically, it's a cat-themed community coin that leans into meme culture the same way most top memecoins do.
It launched with a fixed total supply of 1 billion tokens, and all of them already circulate. No hidden unlock schedule waits to dump on holders later.
People care because Robinhood Chain itself is new and getting attention, and Cash Cat became one of the first tokens riding that early wave.
Why This Small Robinhood Chain Token Is Getting Noticed
This isn't hype built on nothing. Ourbit, a crypto exchange, publicly promoted Cash Cat taking over Robinhood Chain and ran a trading giveaway around it, which pulled in fresh eyes.
And it doesn't stop there. KCEX listed CASHCAT perpetual futures with adjustable leverage up to 25x and zero trading fees on the CASHCAT USDT pair, giving traders a new way to speculate on it.
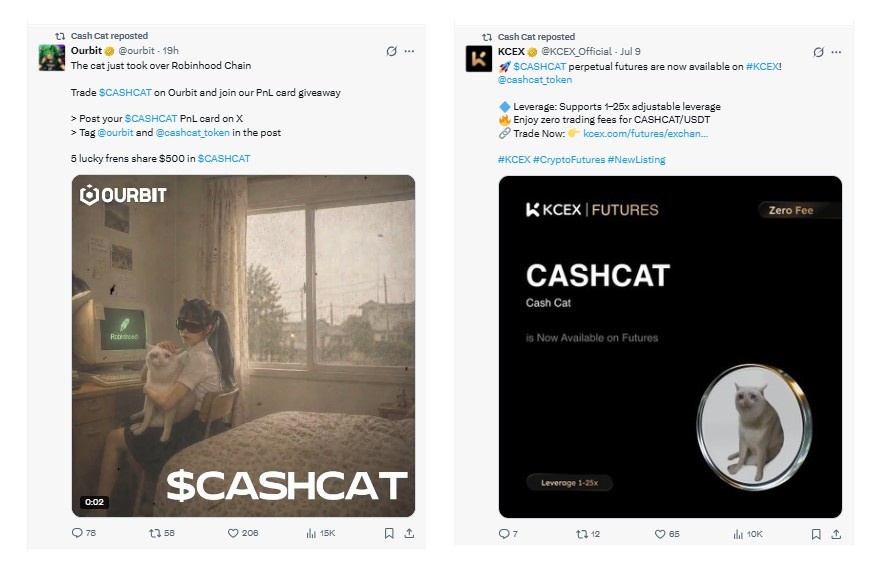
Source: Posted on X by Ourbit (@ourbit) and KCEX (@KCEX_Official)
Momentum kept building from there too, with fresh coverage of the Cash Cat MEXC Ourbit listings alongside Lighter and Aster adding even more exchange depth around the token.
CertiK gave the contract a 3.3 rating, which is decent but not flawless. Worth knowing before sizing any position.
Where CASHCAT Stands After Its Wild Weekly Move
| Field | Value |
|---|---|
| Coin Name | Cash Cat |
| Ticker Symbol | CASHCAT |
| Blockchain | Robinhood Chain |
| Today High | $0.1697 |
| Today Low | $0.08885 |
| RSI Level | 62.28 |
| Token Type | Meme Coin |
| Token Category | Community Token |
| Market Cap | $153.71M |
| 24H Trading Volume | $43.43M |
| 24H Trading Volume Change | -17.42% |
| Circulating Supply | 1,000,000,000 CASHCAT |
| 24H Change | +50.98% |
Source: Data by CoinMarketCap
Price History And How Fast This Coin Has Moved
CASHCAT hit an all-time low of $0.0007991 on July 1, nine days ago. It's now near $0.1537, up well over eighteen thousand percent from that bottom.
The all-time high came four hours ago at $0.1697, and the price has pulled back around 11.53 percent since. A lot of ground covered fast.
Why This Coin Matters Beyond Just The Chart
Cash Cat isn't running on hype alone anymore. It's picked up real exchange support, with both spot and now leveraged futures markets available for traders.
Holder count sits above 14,900 wallets with over 369,000 transfers recorded on-chain, and no single wallet outside the liquidity pool holds more than 3% of the supply.
Cash Cat Liquidation Data Shows Shorts Getting Squeezed
| Timeframe | Long Liquidations | Short Liquidations | Total Liquidations |
|---|---|---|---|
| 1 Hour | $0 | $2.93K | $2.93K |
| 4 Hours | $0 | $4.18K | $4.18K |
| 12 Hours | $36.18 | $4.50K | $4.53K |
| 24 Hours | $123.89 | $5.21K | $5.33K |
Source: Liquidation data by CoinGlass
Short sellers have taken the bulk of the damage across every timeframe here. Basically, traders betting against Cash Cat keep getting caught offside.
Fundamental Analysis Of Cash Cat Right Now
The fundamentals here are thin but not empty. There's a working contract, a growing holder base, and exchange listings backing real trading volume.
But it's still an early stage. No major roadmap is public yet, and that's worth watching.
Technical Price Analysis: Reading The Chart Behind This Move
Breaking: CASHCAT is trading inside a clear ascending channel on the 1-hour chart, and that structure has held for over four days straight now.
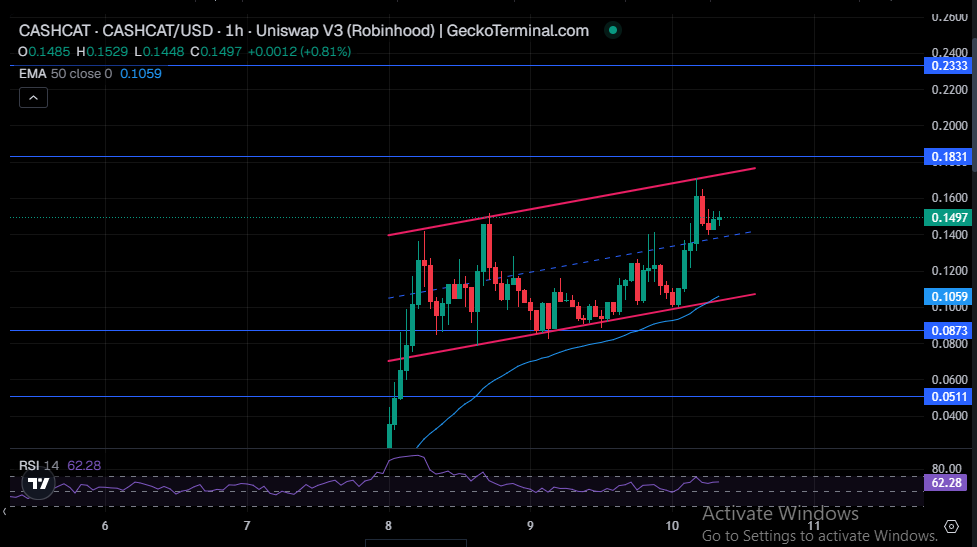
Source: Charting by Gecko Terminal
Price is currently near $0.1497, sitting above its own trendline support but below the recent swing high. Buyers have defended every dip inside this channel so far.
The 50 EMA sits down at $0.1059, well below the current price. That gap tells us the short-term trend is stretched, and some cooling off wouldn't be unusual.
RSI reads 62.28. Not overbought yet, but getting close to the zone where momentum traders start taking profit.
Immediate resistance sits at $0.1831, then $0.2333 above that.
Support underneath sits at $0.1059, then $0.0873, with $0.0511 marked as the level that would flip the setup bearish if lost.
Cash Cat Volume Heatmap Shows Where The Action Is
| Exchange | 24H Volume |
|---|---|
| Aster | $2.96M |
| BingX | $757.78K |
| MEXC | $227.09K |
| LBank | $204.30K |
Source: Volume heatmap by CoinGlass
Aster is carrying the bulk of futures volume here, more than the next three exchanges combined. That's where the real positioning battle is happening.
How CASHCAT Compares To Other Fresh Chain Tokens
Compared to other early chain native tokens, Cash Cat's volume to market cap ratio of 28.93 percent is healthy. It fits the broader pattern seen across altcoin market trends this cycle, showing genuine trading interest rather than a thin, easily manipulated market.
Short-Term Cash Cat Price Prediction For The Coming Weeks
In the near term, price is likely to stay choppy inside the channel unless volume picks back up meaningfully. Here's the short-term breakdown.
| Timeframe | Bearish Target | Base Target | Bullish Target | Key Trigger |
|---|---|---|---|---|
| 24 Hours | $0.1330 | $0.1520 | $0.1700 | Reaction at channel resistance |
| 3-7 Days | $0.1059 | $0.1450 | $0.1831 | Weekly close above resistance |
| 2-4 Weeks | $0.0873 | $0.1600 | $0.2333 | Sustained volume from new exchanges |
Watch the $0.1059 line closely. That's the level separating a healthy pullback from real trend weakness.
Long-Term Cash Cat Price Prediction Through 2026 And Beyond
In the long term, everything depends on whether Robinhood Chain keeps growing and whether Cash Cat keeps its listings and community engaged past this first wave.
| Timeframe | Bearish Target | Base Target | Bullish Target | Catalyst Needed |
|---|---|---|---|---|
| 3 Months | $0.0511 | $0.1400 | $0.2500 | New exchange listings sustain volume |
| 6 Months | $0.0300 | $0.1200 | $0.3000 | Robinhood Chain ecosystem expands |
| End of Year | $0.0200 | $0.1500 | $0.4000 | Community and holder growth continues |
| 2027 Outlook | $0.0100 | $0.1800 | $0.5500 | Chain adoption becomes mainstream |
The long-term case here is speculative, not guaranteed. It leans heavily on Robinhood Chain itself succeeding, not just on Cash Cat as a standalone project.
Three Price Scenarios Traders Should Prepare For
Worst Case: A break below $0.0873 triggers panic selling. Broader market weakness or an exchange delisting could cause this.
Base Case: Price consolidates between $0.10 and $0.18 for several weeks. Most likely outcome given current volume and RSI levels.
Best Case: A confirmed breakout above $0.1831 with rising volume. Needs fresh exchange support or a wider memecoin rotation to fuel it.
| Scenario | Price Range | What Triggers It |
|---|---|---|
| Worst Case | $0.03 - $0.0873 | Break below key support and a broader market sell-off. |
| Base Case | $0.10 - $0.18 | Sideways consolidation with range-bound trading. |
| Best Case | $0.1831 - $0.30+ | Breakout backed by strong volume confirmation. |
Key Price Levels Every Cash Cat Holder Should Be Watching
Resistance zone: $0.1831, above current price. A close above here on strong volume opens the door toward $0.2333.
Support zone: $0.1059 to $0.0873. Buyers have defended this range repeatedly over the past several days.
Invalidation zone: Below $0.0511. A close under this level would break the current bullish structure entirely.
Analyst View And Final Thoughts On Cash Cat
When we pulled up the RSI, the first thing that stood out was how much room is left before this gets overbought. That matters here.
The chart still favors buyers as long as the ascending channel holds. A weekly close above $0.1831 would be the clearest signal yet that momentum continues.
One thing worth tracking beyond the chart: whether more exchanges follow Ourbit and KCEX with fresh listings. That kind of exposure tends to feed directly into volume.
Broader crypto market sentiment also matters here, since a young token like this tends to move with the crowd more than it moves on its own news.
The setup looks more bullish than most latecomers are giving it credit for right now. But that can flip fast as a coin when young.
$0.1059 is the single most important level on this chart. Lose it, and the whole bullish case gets a lot harder to defend.
That's the setup as it stands today.
Disclaimer: This article is for educational purposes only and does not constitute financial advice. Crypto markets are volatile. Consult your investment advisor before making any investment decision.
Also read:

















