Pudgy Penguins Price Prediction: PENGU Rockets 13%, Signal of the Year


Pudgy Penguins started life as an NFT collection before its Pudgy Penguins token, giving the community a way to trade the brand directly, and honestly, it's had a rough go of it since launch, grinding lower for most of the past year.
PENGU is trading at $0.009476, up nearly 13% in a day, with a Pudgy Penguins market cap of $595.984M.
This Pudgy Penguins price prediction digs into whether the move has legs or whether it's about to run out of road.
Live Market Data
Metric | Value |
Price | $0.009476 |
24h Change | +12.9% |
24h Range | $0.008382 - $0.01031 |
Market Cap | $595.984M |
Fully Diluted Valuation | $727.414M |
24h Trading Volume | $478.06M |
Circulating Supply | 62.86B |
Total Supply | 76.723B |
Max Supply | 88.889B |
Source: MarketCap data taken from Coingecko, data as of Aug 24, 2026. Figures may vary slightly across other tracking websites.
Trading Volume
Binance is running the show for $PENGU trading volume on the PENGU USDT pair with $289.41M, and that PENGU Binance figure alone is way out ahead of OKX at $110.00M and Bybit at $89.03M. 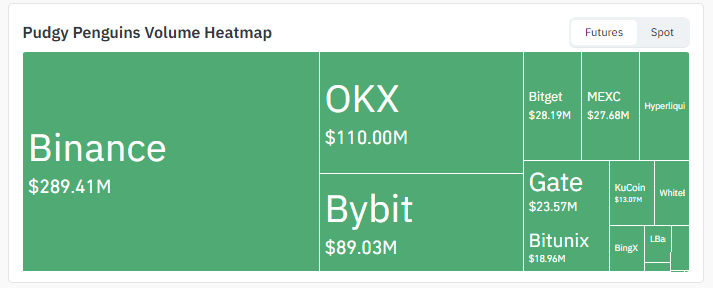
Source: Volume Heatmap Data Taken From Coinglass.
Bitget and MEXC are close to each other at $28.19M and $27.68M, Bitunix sits at $18.96M, and Gate adds another $23.57M. KuCoin, BingX, LBank, and Hyperliquid make up the smaller remainder.
That's a lot of volume concentrated on a handful of big venues, which generally means this breakout attempt has real depth behind it, not just a thin retail chase.
Liquidation Data
Both sides got squeezed on this move. In the past hour, $6.22K got liquidated, split fairly evenly. Zoom out to 24 hours, and it's a different picture entirely: $1.82M wiped out, with longs at $911.10K and shorts at $909.15K, practically a coin flip. 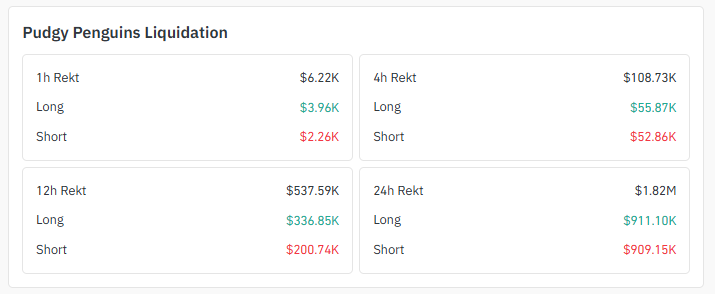
Source: Liquidation Data Taken From Coinglass.
The 12h window shows longs taking the bigger hit at $336.85K against $200.74K in shorts.
That kind of two-sided liquidation data usually points to a volatile chop before a decision gets made, not a clean one-directional squeeze.
Pudgy Penguins New Today
One closely followed trader called out the size of PENGU's recent candle, pointing out it had reclaimed a long-term moving average.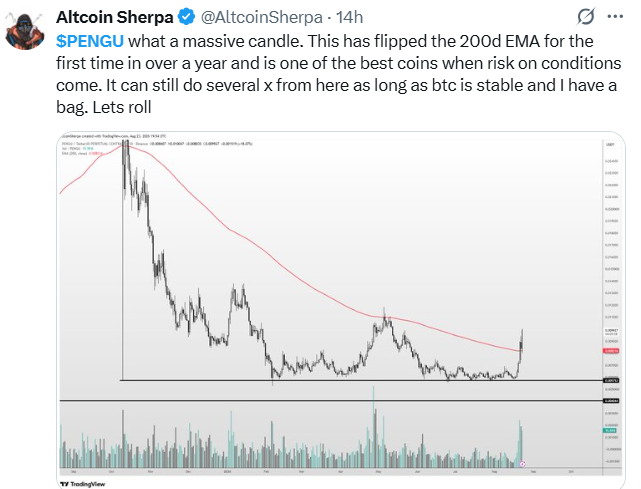
Source: Data Taken From @AltcoinSherpa, X Account.
It hadn't traded above in more than a year and suggested the coin still has real upside left if broader market conditions stay favorable.
Key Takeaways
PENGU price today just ripped 12.9%, trading near $0.009476 and sitting inside a clean ascending channel on the 4h chart.
Price flipped above its 20, 50, 100, and 200 EMAs, something it hadn't managed to do in over a year, and that's the whole story of this Pudgy Penguins price prediction right now.
Stay above the channel's lower edge, and the setup still points higher, toward $0.010351 and then $0.011868.
Lose that lower boundary on volume, though, and PENGU could fall all the way back to $0.007107.
Longs and shorts both got hit hard in the last 24 hours, $1.82M liquidated total, roughly split down the middle.
Technical Analysis: 4-Hour Ascending Channel Structure
Zoom into the 4h chart, and PENGU has been climbing inside a tidy ascending channel for a while now, higher lows stacking neatly under higher highs.
Price is currently sitting mid-channel after a small pullback from the top. Nothing broken yet, just a pause.
Where it goes from this pause is really the whole ballgame for this Pudgy Penguins price prediction.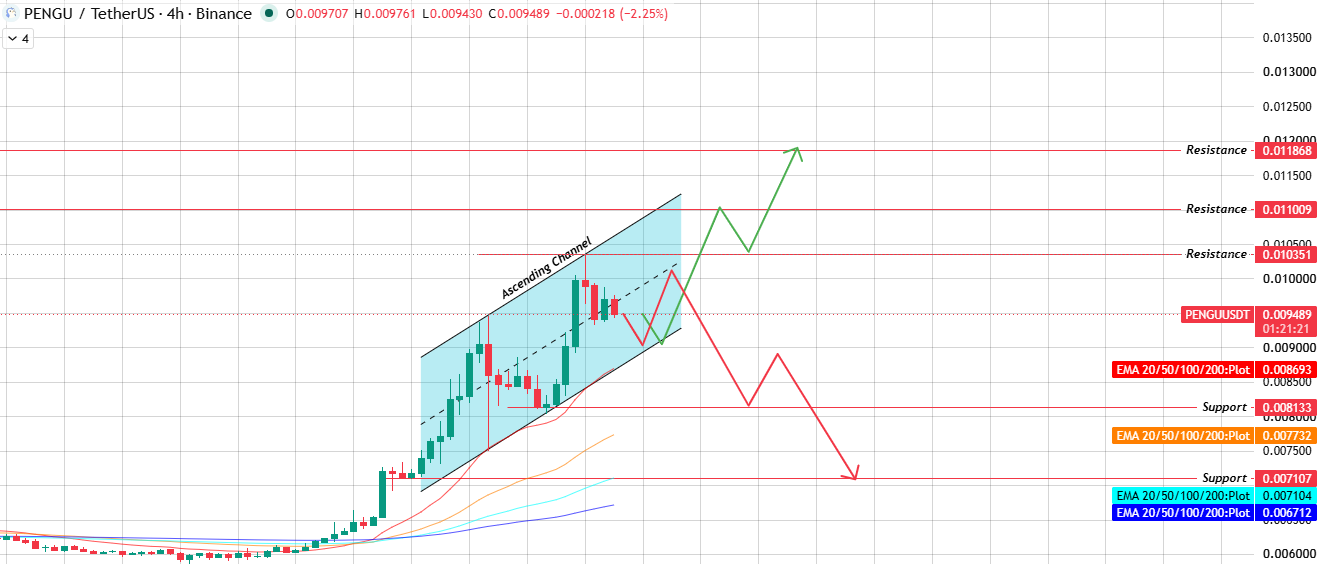
Source: Chart Taken From TradingView.
PENGU Breakout Scenario
Push through the channel's upper trendline with real volume behind it, and PENGU has a shot at $0.010351 first, then $0.011009, and eventually $0.011868 if momentum keeps feeding itself. Volume is the key word there.
A breakout on thin volume tends to fade fast; this one needs conviction behind it to actually stick.
Downside Risk If the Channel Fails
Flip side: if PENGU can't hold the channel's lower boundary and slides through it, $0.008133 becomes the first thing to watch.
Below that, there's not much standing in the way until $0.007107.
Given how sharp the run-up already was, a fakeout back below the channel wouldn't be shocking, so this level matters.
Riding Above All Four EMAs
What actually makes this move different from prior bounces is that price is now trading above its 20, 50, 100, and 200 EMAs all at once. That's a full trend reset, not just a wick. Bulls want to see PENGU hold above that EMA stack on any retest.
EMA Levels
EMA | Value |
EMA 20 | $0.008693 |
EMA 50 | $0.007732 |
EMA 100 | $0.007104 |
EMA 200 | $0.006712 |
This EMA flip above the 200 EMA for the first time in over a year is arguably the bigger headline here, even more than the daily percentage gain itself.
Support and Resistance Levels
Here's where the PENGU resistance levels and PENGU support levels sit right now, straight off the 4h chart.
Level Type | Price |
Resistance 3 | $0.011868 |
Resistance 2 | $0.011009 |
Resistance 1 | $0.010351 |
Support 1 | $0.008133 |
Support 2 | $0.007107 |
Bull Case, Base Case, and Bear Case
Case | Level | Setup |
Bull Case | $0.010351 - $0.011868 | The channel's upper boundary breaks on volume; the PENGU breakout holds above $0.009489. |
Base Case | $0.008133 - $0.010351 | Price stays boxed inside the ascending channel, with no decisive break either way. |
Bear Case | $0.008133 - $0.007107 | The channel's lower boundary breaks, and PENGU slips back below the EMA cluster. |
The bull case invalidates below $0.008133. Bear case invalidates the above $0.010351 on a 4-hour close.
Glossary
Ascending Channel: Two parallel lines, price climbing between them step by step. The breakout direction, up through the top or down through the bottom, usually decides the next real move.
EMA (Exponential Moving Average): Weighs recent candles more heavily than older ones, so it reacts to shifts faster than a plain average would. Flipping above a long-term EMA, like PENGU just did with its 200, tends to catch traders' attention.
Support and Resistance: The price floors and ceilings where buying or selling has historically shown up. Not exact lines so much as zones where the crowd tends to react.
Liquidation: When a leveraged position gets force-closed because there's no margin left to cover the loss. Spikes in liquidation data often line up with the sharpest candles on the chart.
Trading Volume: How much of a token actually changed hands in a given window. A breakout on strong volume carries more weight than the same move on a quiet day.
Methodology
This Pudgy Penguins price prediction leans entirely on what the 4h chart is actually showing: the ascending channel, the EMA structure, and the support and resistance zones it's built around.
Market cap, volume splits by exchange, and liquidation figures came from Coinglass and TradingView and got checked against live data before making it into the article.
No target here is invented; every number traces back to a level on the chart.
Disclaimer: This article is for informational purposes only and does not constitute financial advice. Cryptocurrency markets are highly volatile, and this Pudgy Penguins price prediction should not be treated as a guarantee of future price movement. Always do your own research and consult a licensed financial advisor before making investment decisions.












.webp)




