Dash Price Prediction August 2026: $DASH Triangle Breakdown?


A coin that used to swing hard on privacy-coin hype just slid into one of the quietest, most compressed setups on the chart. No sudden pump, no panic dump, just a slow squeeze between two lines that are about to meet. That kind of setup is exactly why this Dash price prediction August 2026 matters right now. So which way does it break?
Dash Price Prediction: Why $DASH Traders Are Watching the Triangle
This Dash price prediction August 2026 matters because $DASH has spent months carving out a descending triangle on the weekly chart, and those patterns don't sit still forever.
It's been fading since last October's spike toward $58.
Here's the thing: a flat support line under a falling resistance line usually resolves with force, not a slow drift.

There's an evolution-era narrative building in the background too. Dash's own team flagged DApps and private payments as a Q4 focus, and that kind of messaging tends to get traders' attention when price is already coiled tight. Readers following the wider crypto news today cycle have noticed $DASH getting mentioned again after months of silence.
But narrative doesn't confirm a breakout. Price has to do that first.
Is $DASH about to break its year-long slide, or is this triangle just another pause before new lows?
Key Takeaways
$DASH trades near $30.12, down about 0.15% in the past 24 hours per CoinMarketCap, while the daily candle on Binance shows a smaller 0.40% dip to $30.17, a small timing gap worth flagging.
Daily RSI sits at 36.02, leaning weak. Weekly RSI reads 43.62, closer to neutral, and that split is the real story behind this $DASH price prediction August 2026.
The weekly chart is locked inside a descending triangle stretching back to last October, with flat support forming near $28.84 to $30.14.
24-hour liquidations total $18.02K, with longs taking the bigger hit at $12.40K against $5.62K in shorts, a sign of long positioning getting squeezed.
Trading volume fell 34.72% over 24 hours to $36.76M, even as price barely moved, a quiet divergence.
Table of Contents
Why Dash Is Moving This Week
Dash Technical Analysis: Daily Chart
$DASH Technical Analysis: Weekly Chart
$DASH Support and Resistance Levels
$DASH Tokenomics and Supply
Dash Price Prediction: Scenarios By Timeframe
Can $DASH Reach $100?
Risks To Watch
Why Dash Is Moving This Week
Price sits near $30.12, with market cap at $385.26M and 24-hour volume at $36.76M, per CoinMarketCap. That puts the volume-to-cap ratio at 9.67%, thin for a token this size.
Volume dropped 34.72% in a day while price barely budged. And that kind of fade usually means conviction left the room before price did.
Derivatives stayed calm too. Coinglass shows just $18.02K in total liquidations over 24 hours, split $12.40K in long positions and $5.62K in short positions, per the Dash liquidation dashboard.
Binance carries the largest share of $DASH futures flow, followed by LBank and WhiteBIT. Traders watching venue rotation can check the exchange listing tracker for where fresh volume tends to show up first.
Dash Technical Analysis: Daily Chart
DASH/USDT daily, Binance via TradingView, captured July 31, 2026, 12:57 UTC.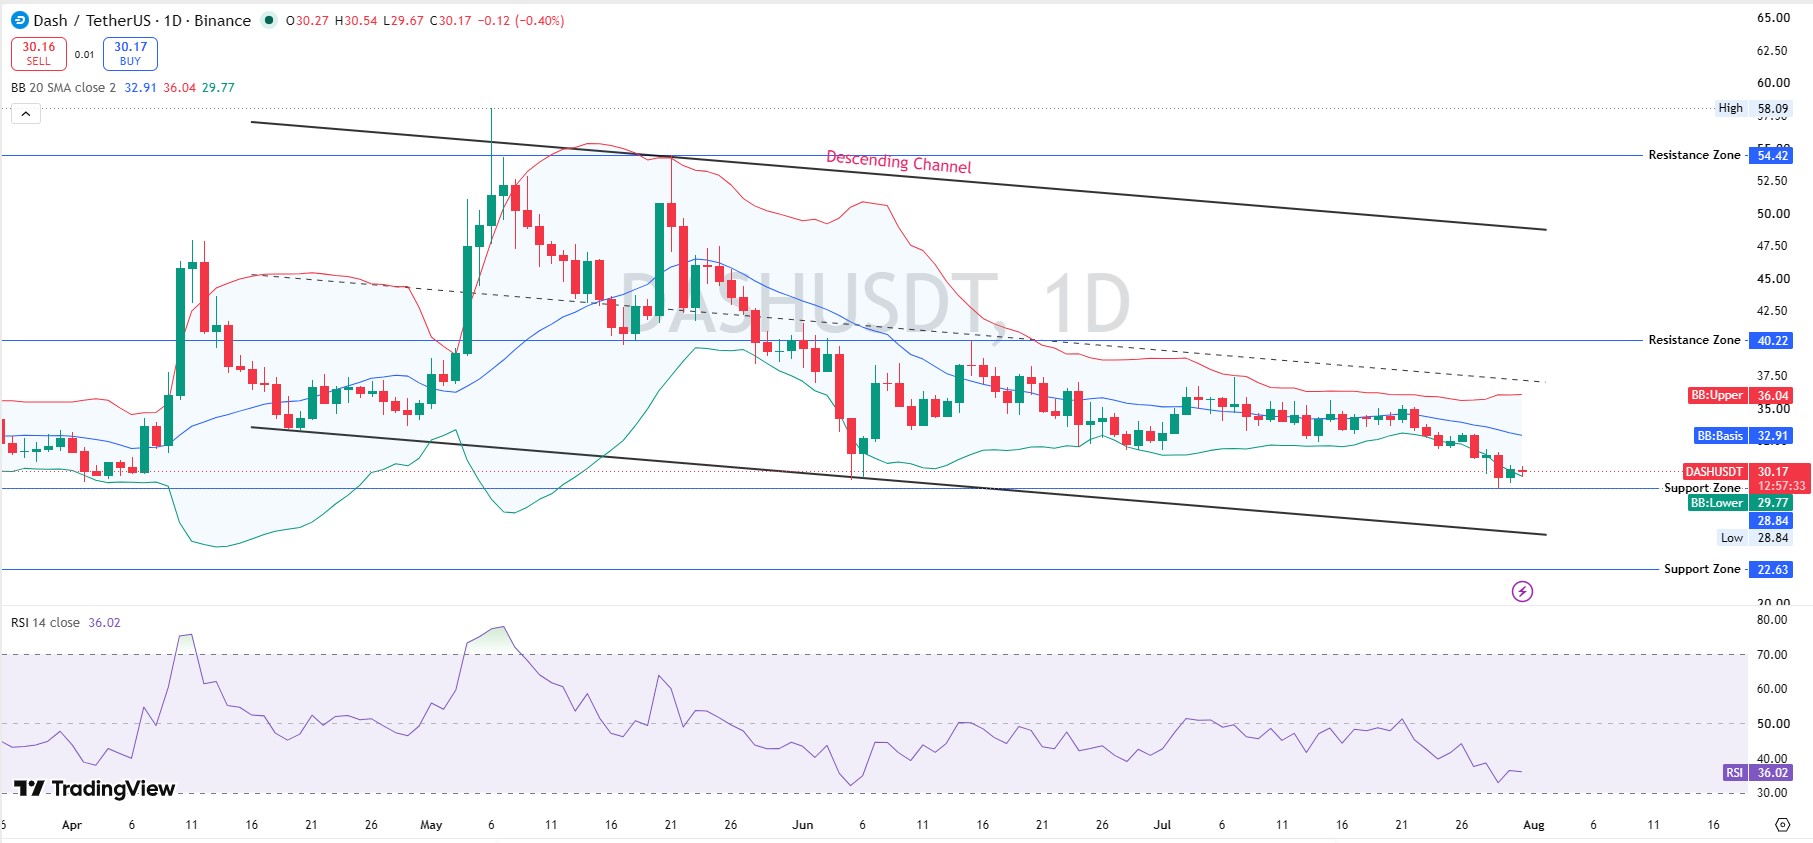
On the daily chart view, $DASH opened at $30.27, ran to a high of $30.54, dipped to $29.67, and closed near $30.17, down 0.40% on the session. Daily Bollinger Bands (20 SMA, close, 2) show the basis at $32.91, the upper band at $36.04, and the lower band at $29.77. Price trades below the basis, a soft short-term structure.
Daily RSI-14 reads 36.02, edging toward oversold but not there yet.
Resistance sits at $36.04, then $40.22, then $54.42. Support runs $29.77, then a deeper zone at $22.63.
$DASH Technical Analysis: Weekly Chart
DASH/USDT weekly, Binance via TradingView, captured July 31, 2026, 12:57 UTC.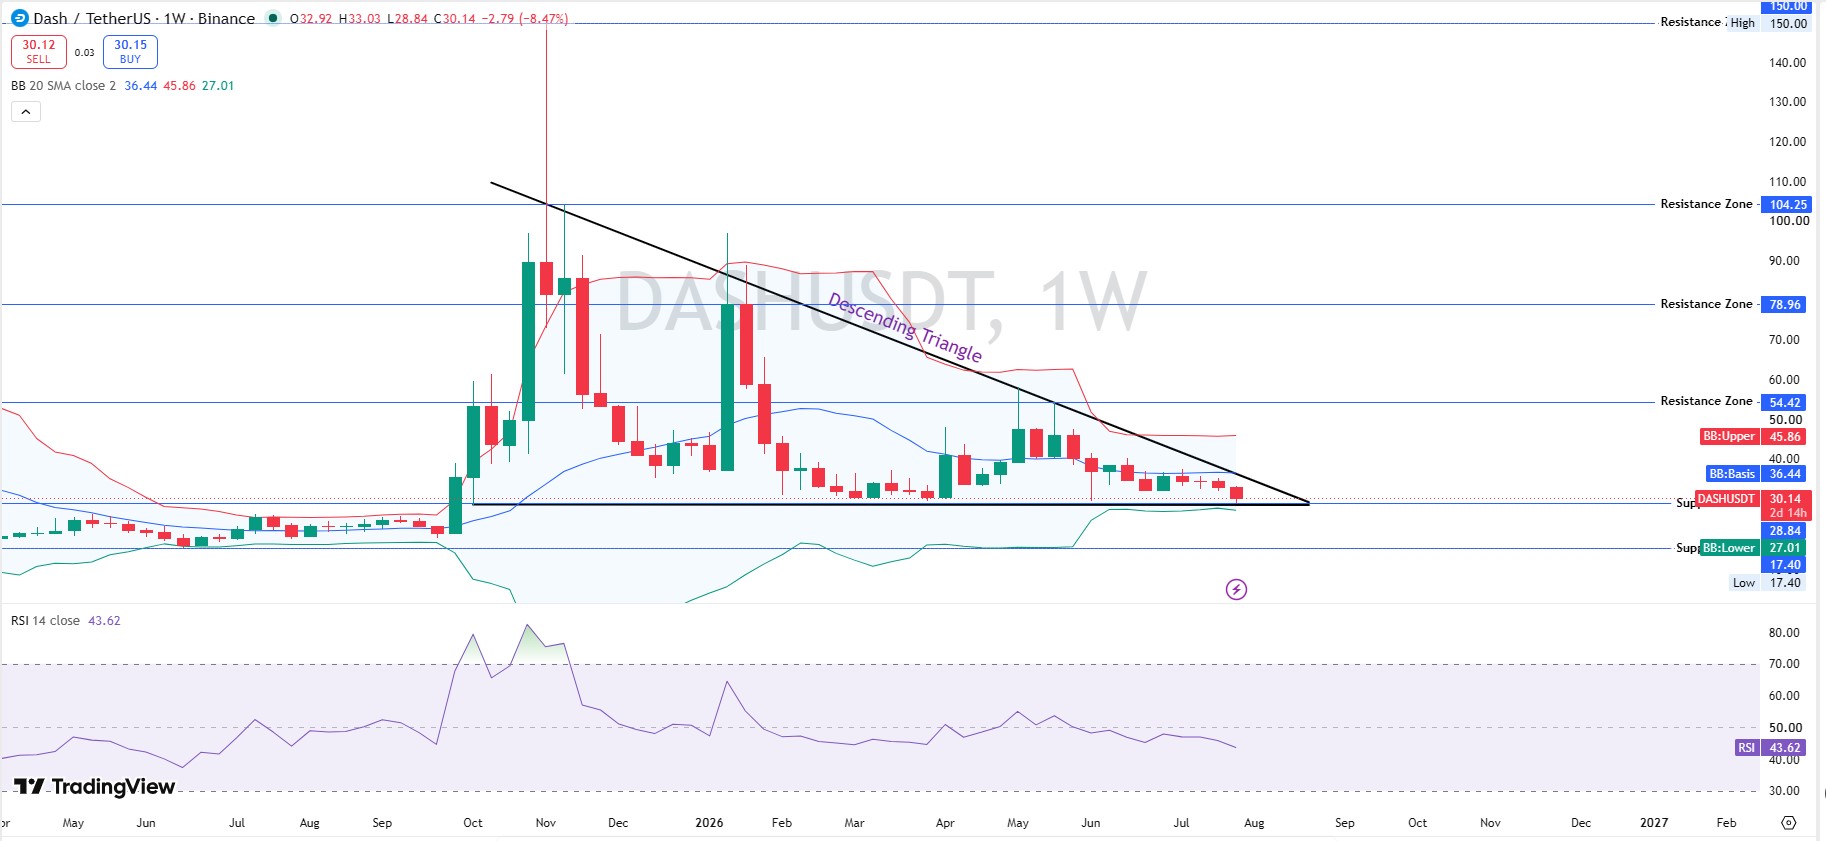
The weekly view tells the fuller Dash forecast story. $DASH opened at $32.92, spiked to $33.03, fell to $28.84, and closed near $30.14, down 8.47% on the week. It's still inside a descending triangle that's been building since October, with flat support around $28.84 to $27.01.
Weekly Bollinger Bands show a basis of $36.44, an upper band of $45.86, and a lower band of $27.01. Weekly RSI sits at 43.62, roughly neutral, which fits a coin that's been grinding lower without a full capitulation candle yet.
When we pulled up the weekly RSI next to the daily reading, the gap between 36 and 43 stood out. Momentum is fading faster on the shorter timeframe.
Dash Support and Resistance Levels
Immediate daily resistance sits at $32.91, then $36.04, then $40.22. A weekly close above $36.44 would be the first real signal this $DASH price target conversation can shift higher.
Support starts at $29.77, and then the weekly triangle floor is near $27.01 to $28.84. Below that, $22.63 is the level that would confirm the triangle has broken down for good.
That's the map traders are working from right now.
$DASH Tokenomics and Supply
The circulating supply sits at 12.78M DASH, matching total supply, against a max supply of 18.9M $DASH per CoinMarketCap. The fully diluted valuation reads $569.34M, well above the current $385.26M market cap.
CertiK rates the project 4.1 out of 5 stars. And with total supply already equal to circulating supply, there's no near-term unlock overhang hanging over this $DASH price prediction for August 2026.
$DASH is down 98.17% from its all-time high of $1,642.22, set back on December 20, 2017. It's up 13,945.6% from its all-time low of $0.2139, hit on February 14, 2014.
Dash Price Prediction: Scenarios By Timeframe
Timeframe | Bull Case | Base Case | Bear Case |
24H | Reclaims $32.91, tests $36.04 (probability: low-moderate) | Holds $29.77-$32.91 range (probability: high) | Slips under $29.77 toward $27.01 (probability: moderate) |
7D | A weekly close above $36.44 shifts structure (probability: low) | Range-bound $27.01-$33.00 (probability: high) | Triangle breaks down toward $22.63 (probability: moderate) |
August 2026 | Evolution/Q4 narrative lifts DASH toward $40-$45 (probability: low) | Chops between $27-$36 through the month (probability: moderate) | Weak volume drags price to $20-$25 (probability: low-moderate) |
Invalidation for the bullish case is a daily close under $29.77. These reads are tied to the current setup, not guarantees, and thin volume can push any of these levels faster than the table suggests.
Can $DASH Reach $100?
Not in this stretch. Going from $30.12 to $100 needs more than a 3x move, and $DASH would first need to clear every resistance zone up to $54.42 and $78.96. A more realistic Dash price target for August sits closer to the $40 zone, the first major resistance flagged above, not triple digits.
Risks To Watch
Weak volume tops the list. A 34.72% drop in 24-hour volume while price holds steady rarely ends with a clean breakout.
Long liquidations already outpaced shorts this week.
And the triangle pattern itself carries downside risk if support at $27.01 gives way. For sector-wide context, the Bitcoin price prediction 2026 coverage tracks how majors are holding up.
Ethereum tells a similar story right now. The Ethereum price prediction 2026 outlook shows the same cautious tone across large caps.
Whether Dash is a good investment right now depends on risk tolerance, since a coiled triangle with fading volume cuts both ways.
Readers can also track the Dash price surge today coverage of the fuller privacy coin picture.
Dash's own team also teased Evolution-era DApp activity heading into Q4, a detail worth folding into any longer Dash forecast. The crypto news coverage hub carries ongoing updates on that story.
Upcoming catalysts worth watching sit on the coin events calendar.
Methodology: Chart levels from DASH/USDT daily and weekly charts on Binance via TradingView, RSI-14, and 20-period Bollinger Bands, captured on July 31, 2026, at 12:57 UTC. Market and supply data from CoinMarketCap. Liquidation and futures volume from Coinglass. This is speculative market commentary, not financial advice.
Disclaimer: This is speculative market commentary, not financial advice. Crypto assets are volatile. Data is current as of July 31, 2026, 12:57 UTC; verify live figures before trading.











.jpg)






